

Removals by ethnicity/race in Pima Couty
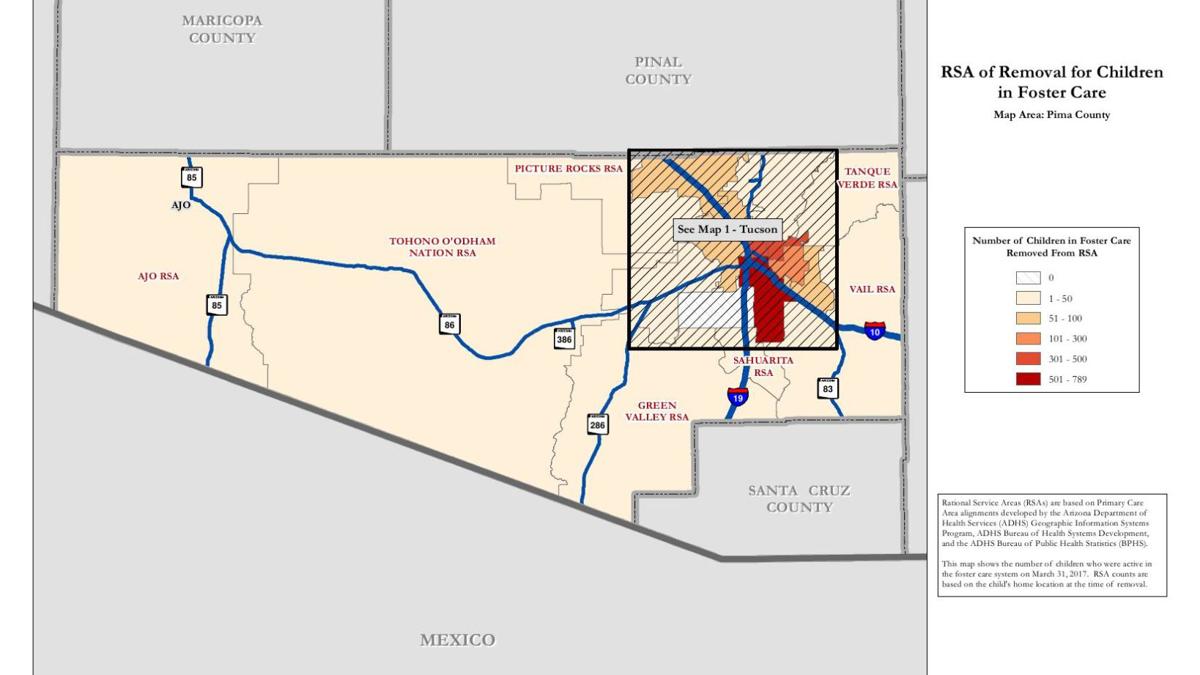
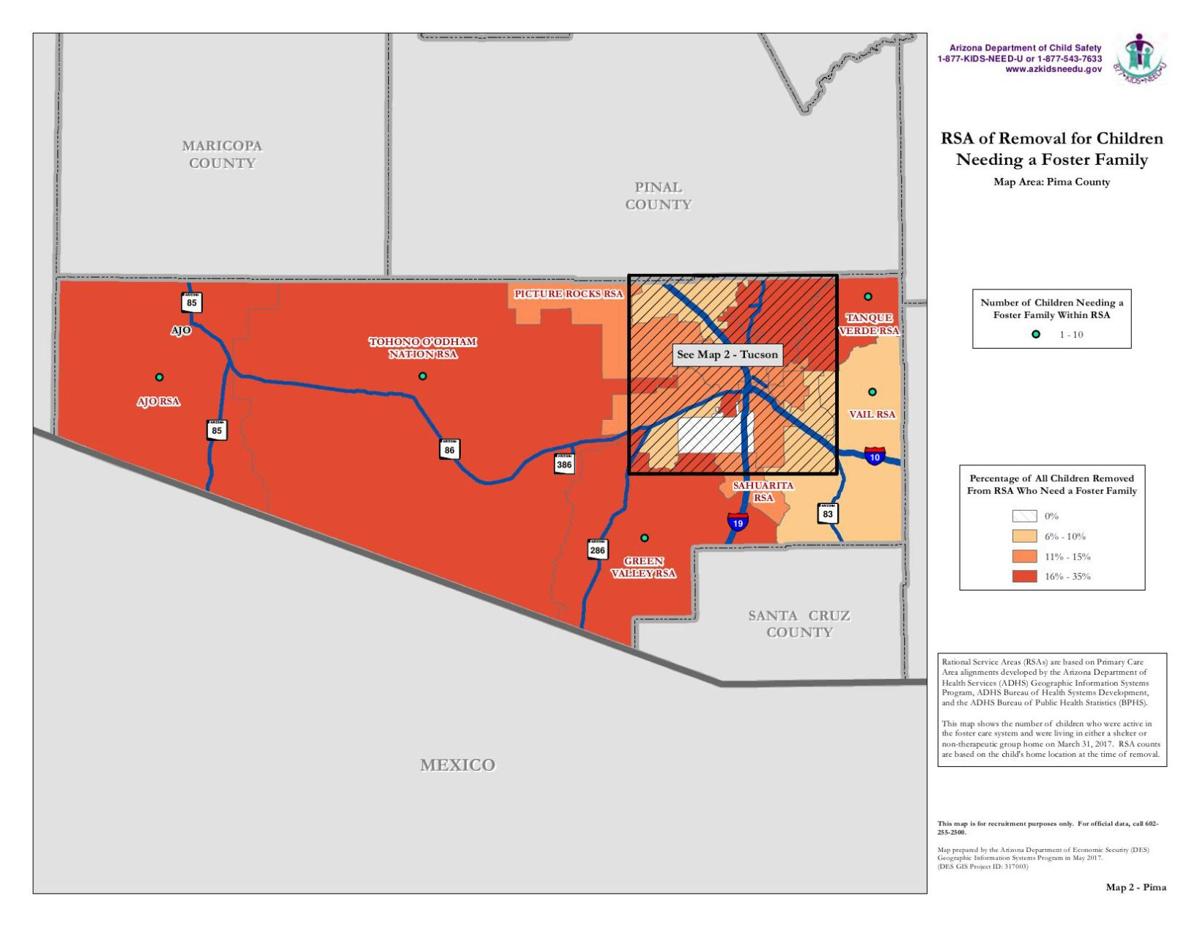
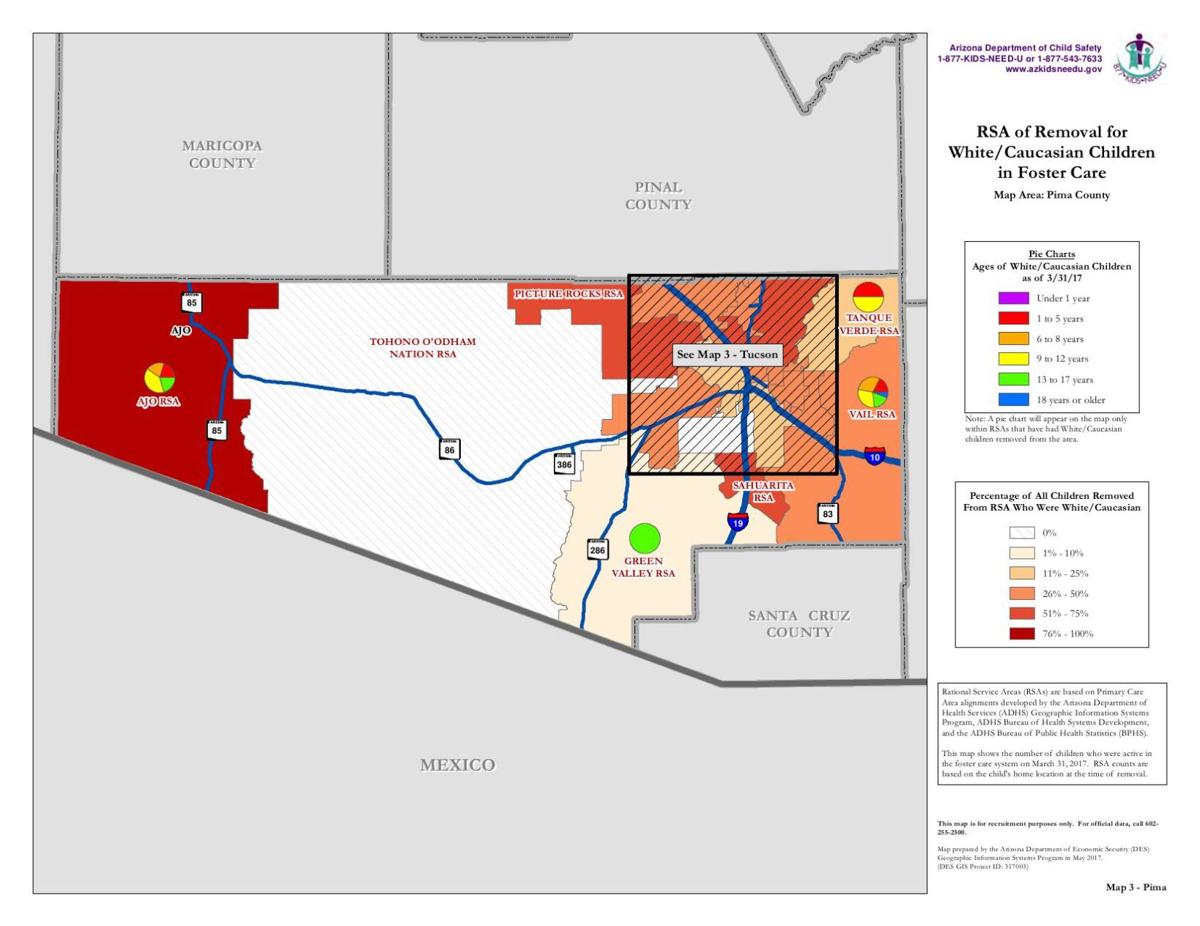
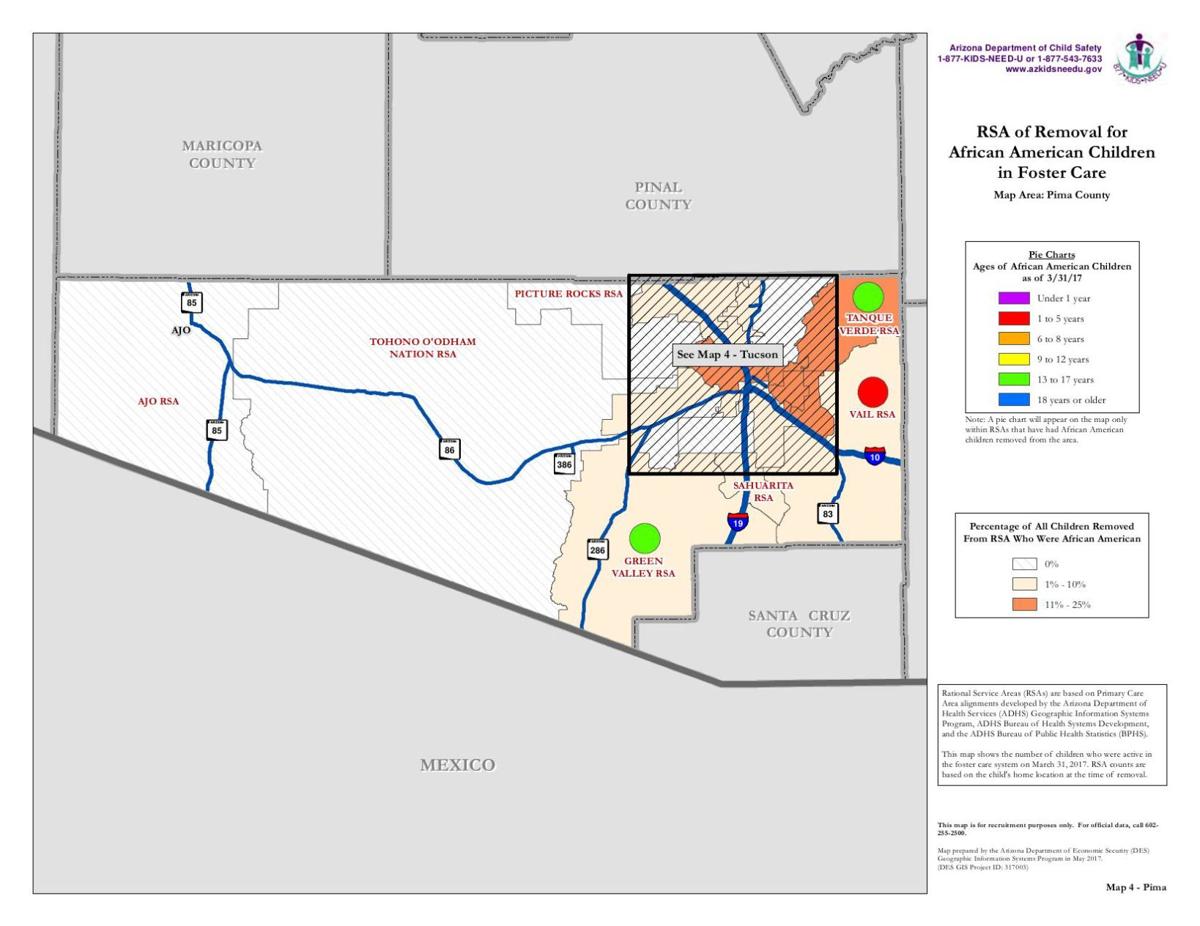
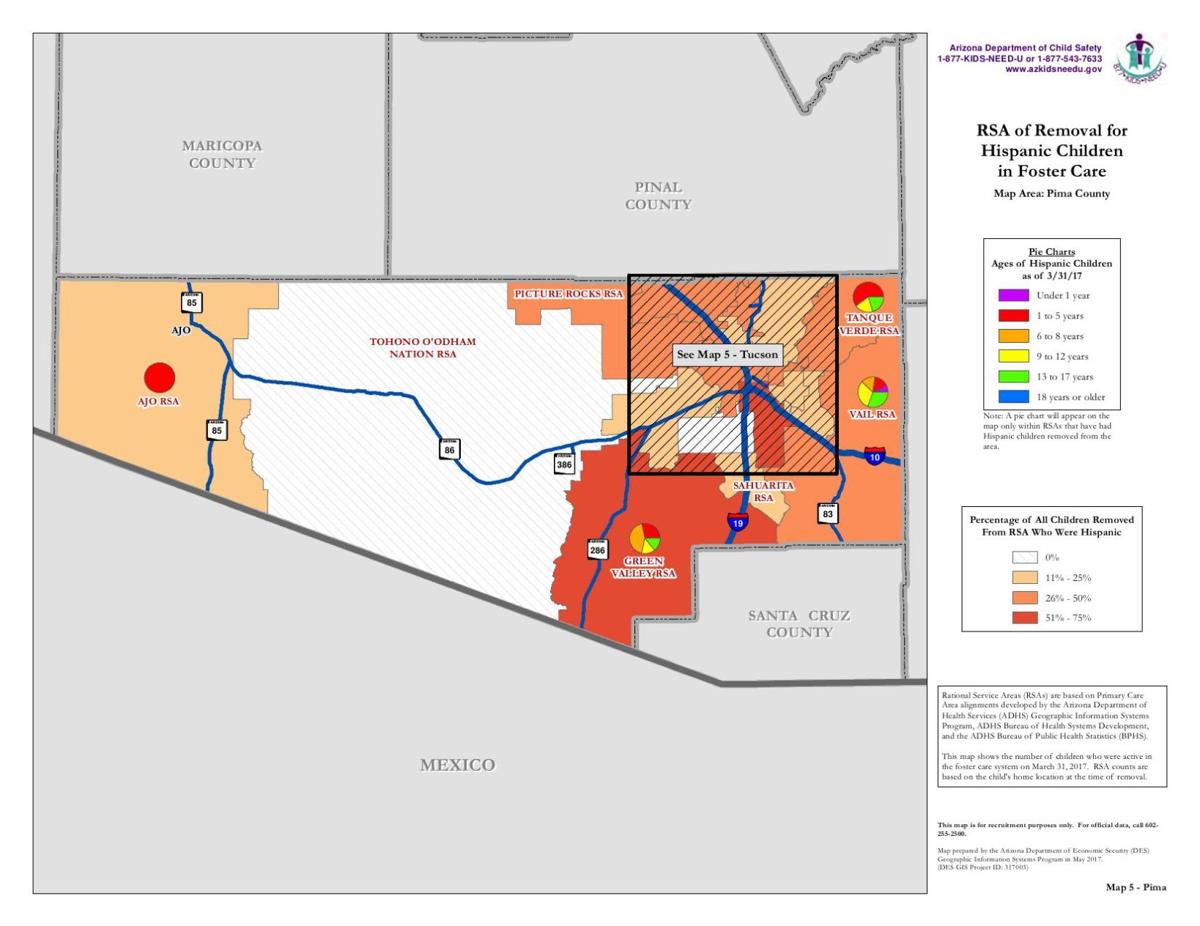
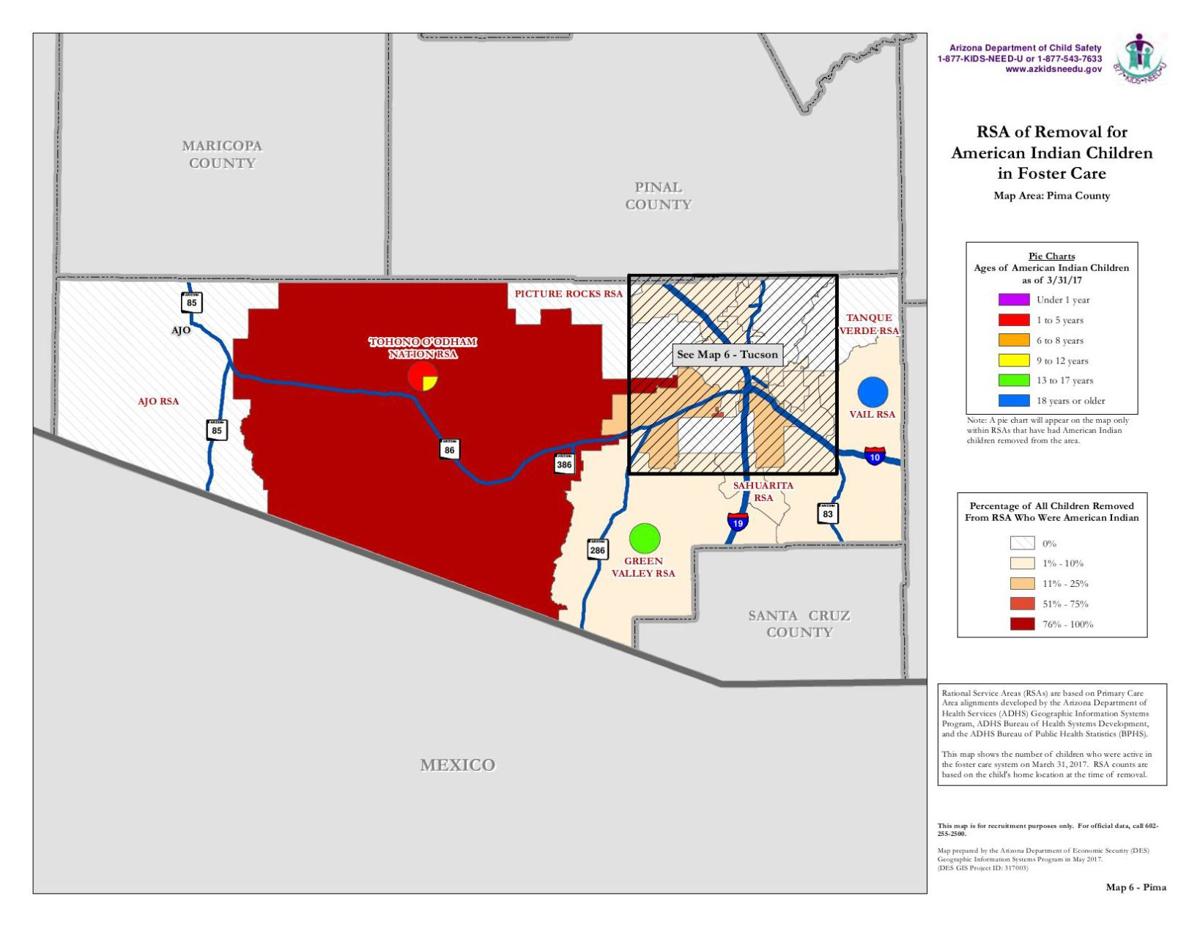

Arizona has one of the highest rates of children removed from their families in the nation, and more than 60 percent are children of color.
Get up-to-the-minute news sent straight to your device.