Skip to main contentSkip to main content
Register for more free articles.
Log in Sign up
Back to homepage
Subscriber Login
Keep reading with a digital access subscription.
Subscribe now
You have permission to edit this collection.
Edit
Arizona Daily Star
98°
  • Sign in
  • Subscribe Now
  • Manage account
  • Logout
    • Manage account
    • e-Newspaper
    • Logout
  • News
    • Sign up for newsletters
    • Local
    • Arizona
    • Business
    • Crime
    • Nation & World
    • Markets & Stocks
    • SaddleBrooke
    • Politics
    • Archives
    • News Tip
  • Arizona Daily Star
    • E-edition
    • E-edition-Tutorial
    • Archives
    • Special Sections
    • Merchandise
    • Circulars
    • Readers' Choice Awards
    • Buyer's Edge
  • Obituaries
    • Share Your Story
    • Recent Obituaries
    • Find an Obituary
  • Opinion
    • Submit a Letter
    • Submit guest opinion
    • Letters to the Editor
    • Opinion & Editorials
    • National Columnists
  • Sports
    • Arizona Wildcats
    • Greg Hansen
    • High Schools
    • Roadrunners
  • Lifestyles
    • Events Calendar
    • Arts & Theatre
    • Food & Cooking
    • Movies & TV
    • Movie Listings
    • Music
    • Comics
    • Games
    • Columns
    • Play
    • Home & Gardening
    • Health
    • Get Healthy
    • Parenting
    • Fashion
    • People
    • Pets
    • Travel
    • Faith
    • Retro Tucson
    • History
    • Travel
    • Outdoors & Rec
    • Community Pages
  • Brand Ave. Studios
  • Join the community
    • News tip
    • Share video
  • Buy & Sell
    • Place an Ad
    • Shop Local
    • Jobs
    • Homes
    • Marketplace
    • I Love A Deal
  • Shopping
  • Customer Service
    • Manage My Account
    • Newsletter Sign-Up
    • Subscribe
    • Contact us
  • Mobile Apps
  • Weather: Live Radar
  • Facebook
  • Twitter
  • Bluesky
  • YouTube
  • Pinterest
  • Instagram
© 2026 Lee Enterprises
Terms of Service | Privacy Policy
Arizona Daily Star
News+
Read Today's E-edition
Arizona Daily Star
News+
  • Log In
  • $1 for 3 months
    Subscribe Now
    • Manage account
    • e-Newspaper
    • Logout
  • E-edition
  • News
  • Obituaries
  • Opinion
  • Wildcats
  • Lifestyles
  • Newsletters
  • Comics & Puzzles
  • Buyer's Edge
  • Jobs
  • 98° Sunny
Share This
  • Facebook
  • Twitter
  • Bluesky
  • WhatsApp
  • SMS
  • Email
The 10 cities with the hardest-working parents
Share this
  • Facebook
  • Twitter
  • Bluesky
  • WhatsApp
  • SMS
  • Email
  • Print
Spotlight

The 10 cities with the hardest-working parents

  • By Allison Kade, MeetFabric.com
  • Oct 3, 2019
  • Oct 3, 2019

In 1970, both spouses worked full-time in only 31 percent of two-parent households. By 2015, that number was 46 percent.

Intro

Photo Credit: Alamy Stock Photo

Parents have always had to juggle a lot of responsibilities, including careers, children, personal relationships and hobbies. The workload on today’s parents has only increased in recent years as a result of the growing size of American families and the rise of dual-income households.

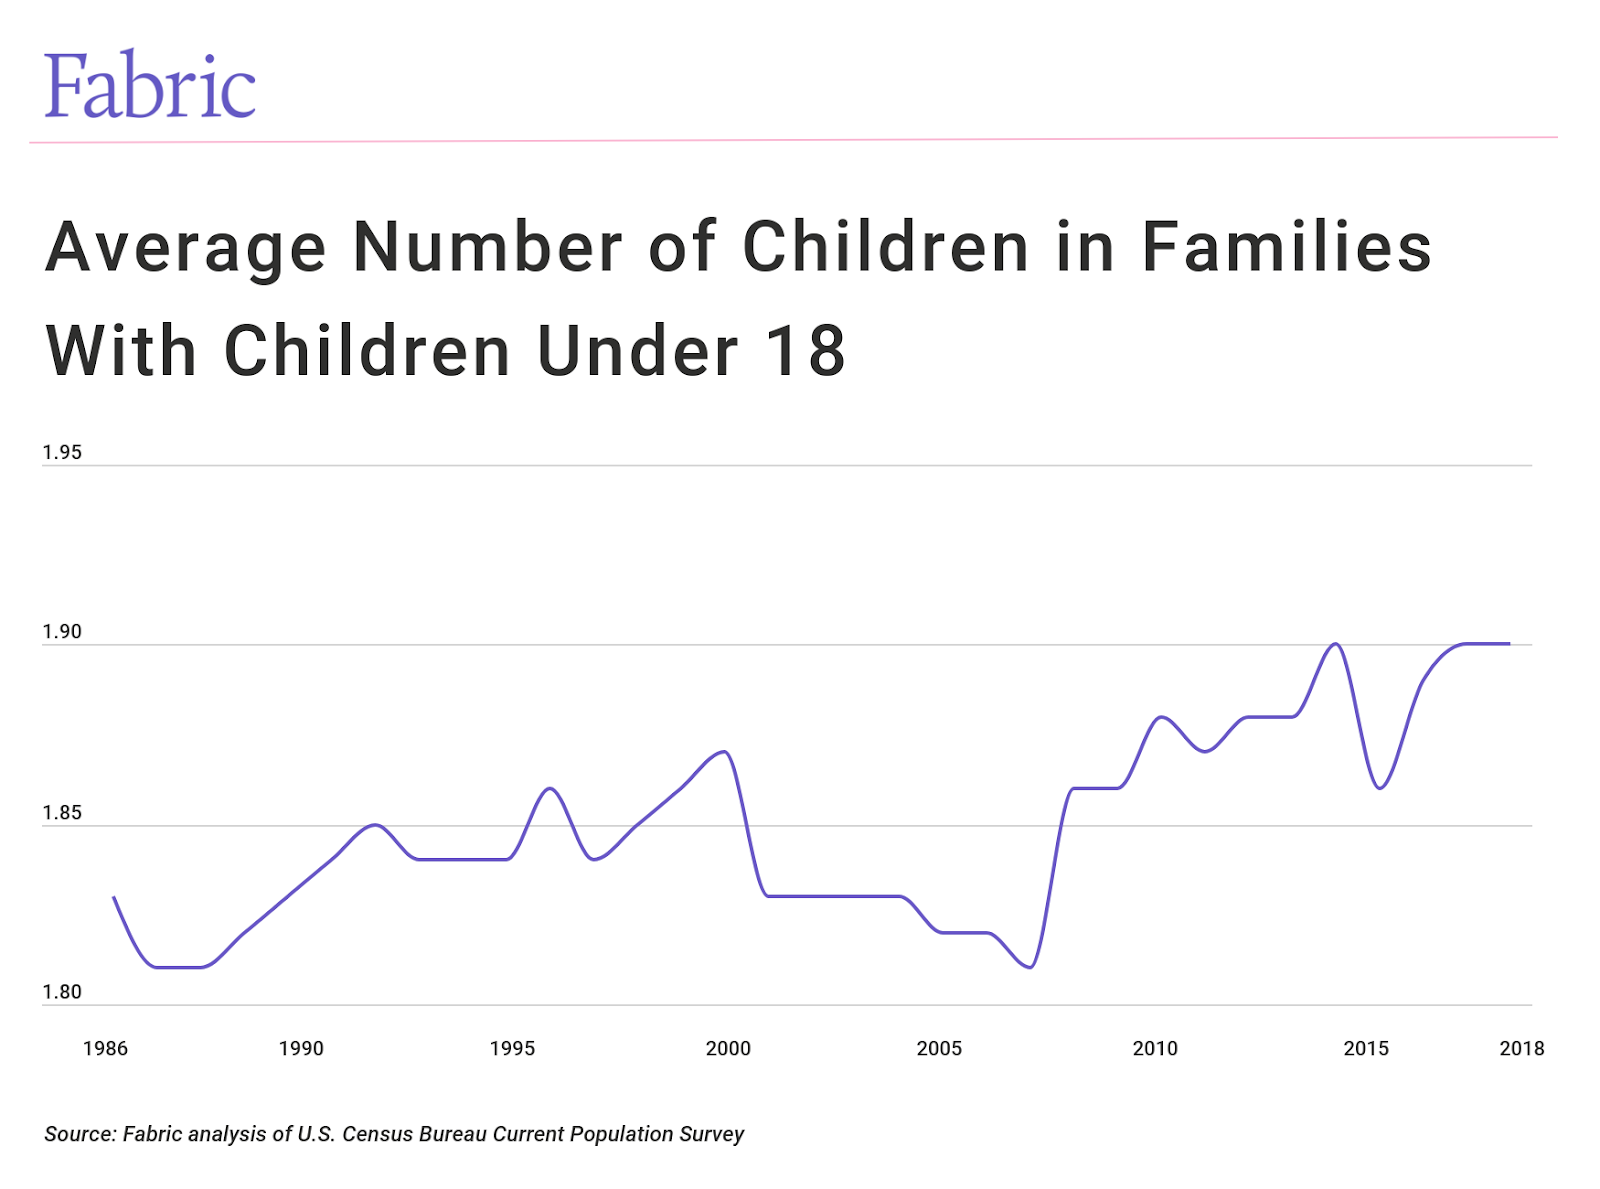
After falling for many decades since the mid 1980s, the average family size in America has inched higher. Among families with children under 18, the number of kids increased from a low of 1.81 per family in 1987 to 1.9 per family in 2018. Middle-income parents will spend $233,610 raising a child through age 17 (for a kid born in 2015), according to the U.S. Department of Agriculture. That doesn’t even include college.

Even while families have grown, so has parental participation in the workforce. Compared to decades past, today’s two-parent families are more likely to both work full-time, according to Pew Research.

In 1970, both spouses worked full-time in only 31% of two-parent households; by 2015, that number was 46%. According to 2017 Census data, over 78% of parents are employed in some capacity and 64% work full-time, among families with children under 18 (including two-parent and single-parent households).

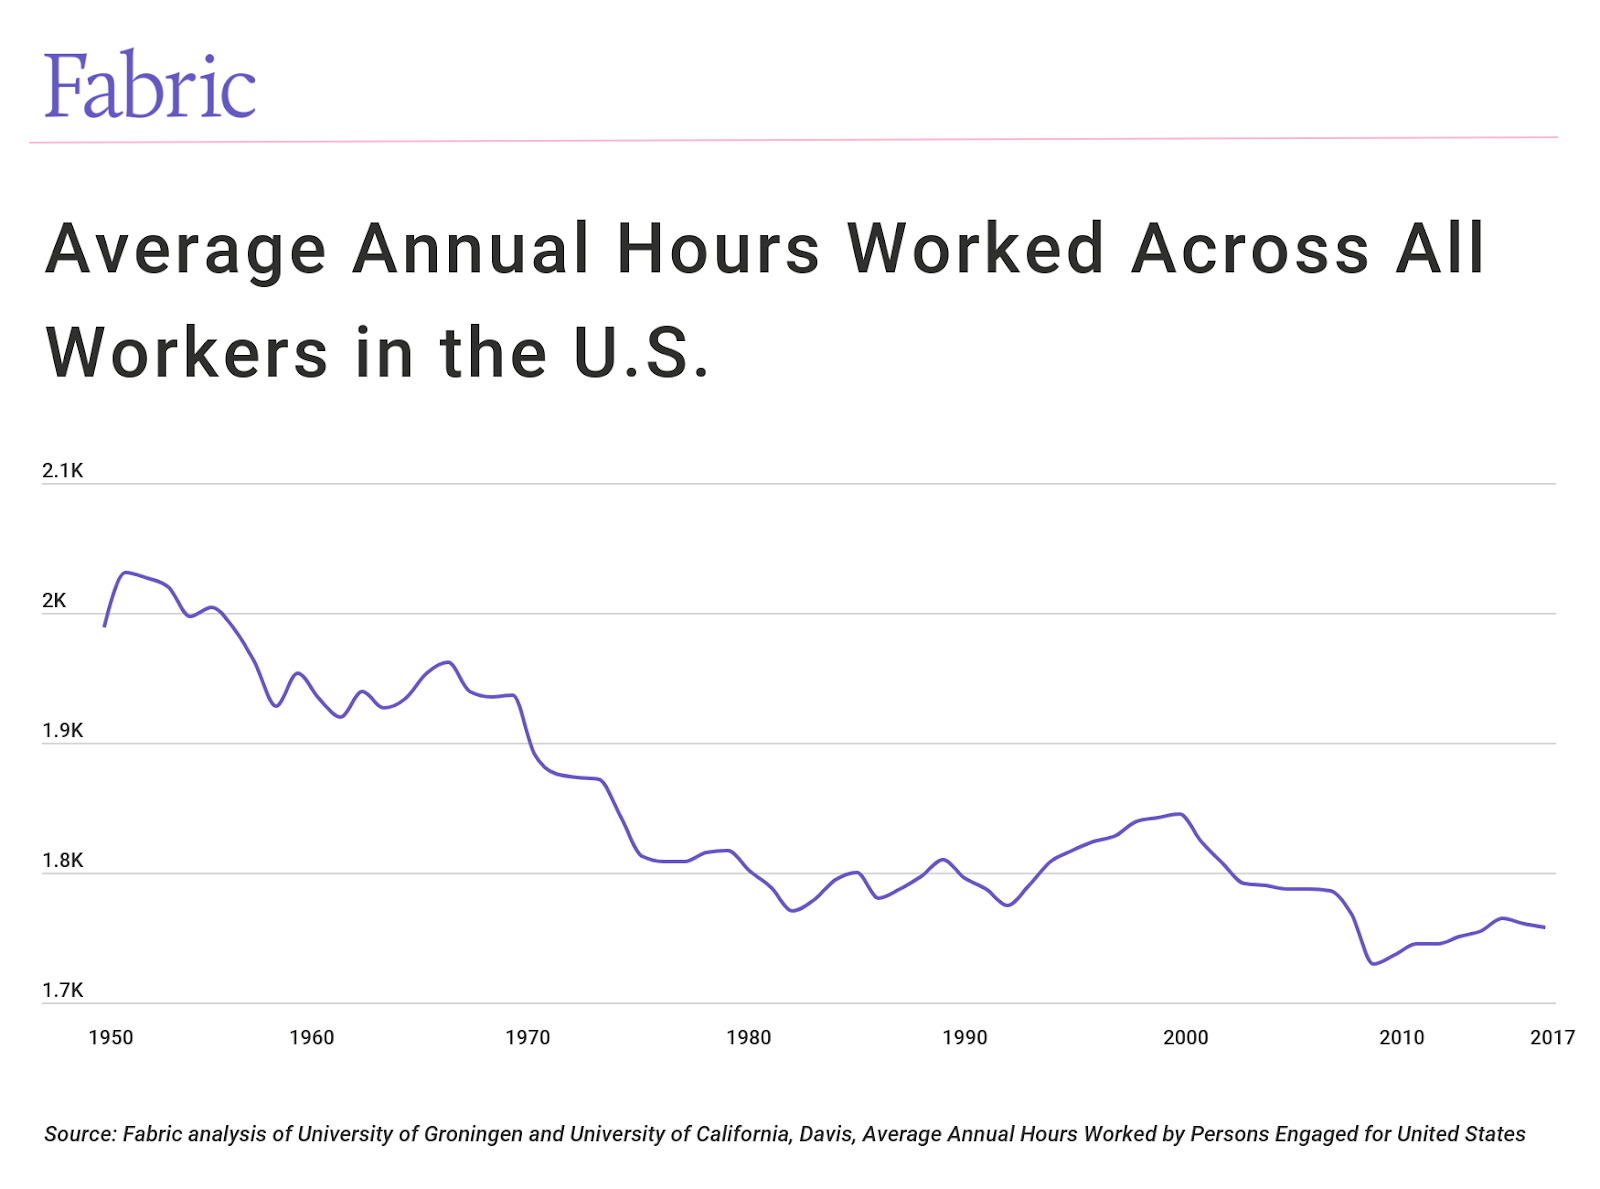
It’s worth noting that Americans today tend to work fewer hours and have more flexible schedules. That said, technology has transformed the way we work, when we work and what qualifies as work.

According to Gallup’s 2017 State of the American Workplace report, 43% of U.S. employees work remotely at least some of the time, a four-percentage-point increase from 2012. While telecommuting offers workers more flexibility, it also creates pressure to bring work home.

Research from the University of Toronto found that about 50% of people bring their work home, leading to higher stress and interference in personal life. Always being “on call” blurs the distinction between work and home and affects the time families spend together.

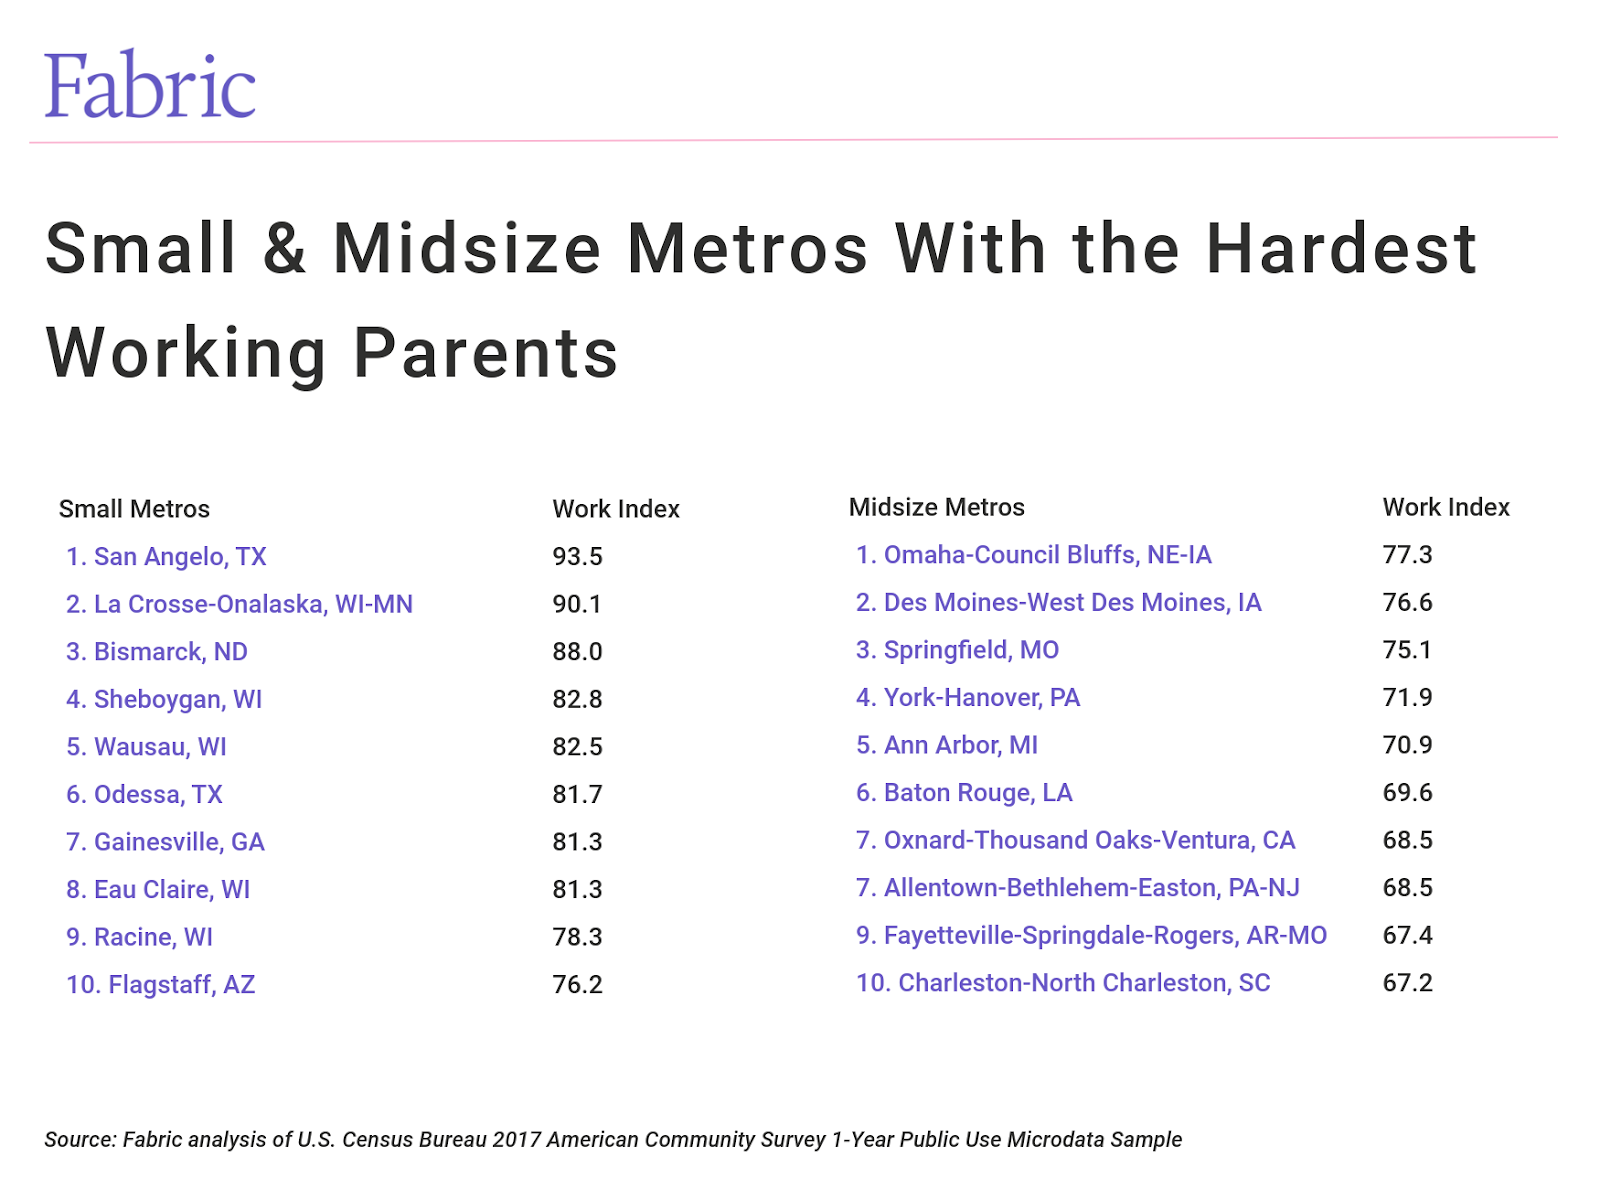
With these trends in mind, researchers at Fabric wanted to find which cities have the hardest-working parents. To do this, they analyzed data from the U.S. Census on parents with kids under 18. They created a composite score—referred to below as the “work index”—based on the following factors:

  • Average total working and commuting time for parents
  • Percentage of parents employed full-time
  • Percentage of parents not employed
  • Average number of children under 18

In addition to looking at employment and commuting statistics—a reflection of workload outside of the home—Fabric considered the average number of kids in each household as an indicator of workload at home. Only metropolitan areas with at least 100,000 people were included and metros were grouped based on population size.

First, they identified small and midsize cities where parents work the hardest.

Then, they crunched the numbers to identify the top ten big cities with the hardest-working parents. Here’s what they found.

10. Dallas-Fort Worth-Arlington, TX

Photo Credit: Alamy Stock Photo

  • Work index: 70.5
  • Average working & commuting time for parents: 46.6 hours per week
  • Percentage of parents employed full-time: 67.4%
  • Percentage of parents not employed: 22.2%
  • Average number of children under 18: 1.89

The largest metro on this list by population, Dallas-Fort Worth is one of the nation’s major economic hubs. Some of the area’s largest employers include American Airlines, Lockheed Martin and the University of Texas.

Most employees get to work by car, but the area’s notorious traffic leads to long commutes. Compared to the rest of the U.S., parents in Dallas spend more total time working and commuting, and a greater share of parents work full-time.

9. Denver-Aurora-Lakewood, CO

Photo Credit: Alamy Stock Photo

  • Work index: 71.3
  • Average working & commuting time for parents: 45.4 hours per week
  • Percentage of parents employed full-time: 66.8%
  • Percentage of parents not employed: 18.3%
  • Average number of children under 18: 1.87

About two-thirds of parents in the greater Denver area are employed full-time, and only 18.3% do not work at all. Denver’s diversified economy provides ample job opportunities for parents, and some of the major industries include energy, bioscience, healthcare, aerospace and aviation. Commuters tend to drive to work or use the RTD Bus & Rail, which is Denver’s main public transit system.

8. Atlanta-Sandy Springs-Roswell, GA

Photo Credit: Alamy Stock Photo

  • Work index: 72.1
  • Average working & commuting time for parents: 47.0 hours per week
  • Percentage of parents employed full-time: 67.2%
  • Percentage of parents not employed: 20.7%
  • Average number of children under 18: 1.86

Atlanta is one of the South’s main economic centers, and parents spend an average of 47 hours per week commuting and working in this bustling city. Several Fortune 500 companies are headquartered in Atlanta, including Coca-Cola, UPS, Delta and Home Depot. Commuting within the city is fast and convenient, with public transportation options including the Metropolitan Atlanta Rapid Transit Authority (MARTA) and the Atlanta Streetcar.

However, parents coming to work from the suburbs will face traffic on the city’s crowded streets, leading to longer commute times.

7. Austin-Round Rock, TX

Photo Credit: Alamy Stock Photo

  • Work index: 72.3
  • Average working & commuting time for parents: 46.3 hours per week
  • Percentage of parents employed full-time: 67.7%
  • Percentage of parents not employed: 20.9%
  • Average number of children under 18: 1.87

The burgeoning tech hub of Austin is home to major employers such as Facebook, Google and Dell. As many families move to the suburbs in order to find affordable housing options, parents face longer commutes. Most commuters in Austin rely on driving to work, and traffic congestion exacerbates travel time. While Austin boasts a low unemployment rate, about one of five parents are not employed—a figure that suggests a conscious choice to prioritize home life over work.

6. Indianapolis-Carmel-Anderson, IN

Photo Credit: Alamy Stock Photo

  • Work index: 76.0
  • Average working & commuting time for parents: 46.3 hours per week
  • Percentage of parents employed full-time: 67.8%
  • Percentage of parents not employed: 19.1%
  • Average number of children under 18: 1.87

Parents working in Indianapolis benefit from a highly diversified economy, with industry sectors ranging from tech and manufacturing to motorsports and life sciences. Compared to other cities, parents in Indianapolis work and commute longer hours, and a greater share work full-time.

5. Washington-Arlington-Alexandria, DC-VA-MD-WV

Photo Credit: Alamy Stock Photo

  • Work index: 76.4
  • Average working & commuting time for parents: 47.2 hours per week
  • Percentage of parents employed full-time: 69.6%
  • Percentage of parents not employed: 18.0%
  • Average number of children under 18: 1.81

Across all metros, Washington D.C. has one of the largest proportions of parents employed full-time, at 69.6%. Washington D.C. also has the longest average working and commuting time for parents, at 47.2 hours per week. The federal government is a leading employer for the greater D.C. area, and many parents commute from neighboring cities and suburbs. At least the time burden at home may be a bit lighter than elsewhere; parents in the Washington D.C. metro area tend to have slightly fewer kids than average, at 1.81 per family.

4. Baltimore-Columbia-Towson, MD

Photo Credit: Alamy Stock Photo

  • Work index: 76.9
  • Average working & commuting time for parents: 46.5 hours per week
  • Percentage of parents employed full-time: 69.2%
  • Percentage of parents not employed: 17.8%
  • Average number of children under 18: 1.83

Working parents in Baltimore benefit from a walkable downtown, as well as extensive public transportation options through the subway or bus system. Major employers in the Baltimore area include federal agencies such as the Social Security Administration, colleges such as the University of Maryland and Towson University, and healthcare providers such as the Greater Baltimore Medical Center. Baltimore parents have an average of 1.83 children, which is lower than the national average of 1.89, but almost 70% of parents work full-time.

3. Milwaukee-Waukesha-West Allis, WI

Photo Credit: Alamy Stock Photo

  • Work index: 78.2
  • Average working & commuting time for parents: 44.7 hours per week
  • Percentage of parents employed full-time: 69.6%
  • Percentage of parents not employed: 16.9%
  • Average number of children under 18: 1.95

Milwaukee is home to major employers such as Harley-Davidson, Northwestern Mutual and Kohl’s. Compared to the other metros on this list, Milwaukee has the lowest average working and commuting time for parents, at 44.7 hours per week, though it is still above the national average of 40.6. Milwaukee still made this list, however, because parents have an average of 1.95 children under 18, much higher than the national average—implying that Milwaukee parents are doing plenty of hard work on the home front.

2. Kansas City, MO-KS

Photo Credit: Alamy Stock Photo

  • Work index: 81.1
  • Average working & commuting time for parents: 45.6 hours per week
  • Percentage of parents employed full-time: 68.5%
  • Percentage of parents not employed: 18.7%
  • Average number of children under 18: 1.96

Among the cities on this list, Kansas City has the highest average number of children under 18, at 1.96 per family. Despite having larger families, parents manage to spend more than 45 hours per week working and commuting. Major industries in Kansas City include health services, government and education.

1. Minneapolis-St. Paul-Bloomington, MN-WI

Photo Credit: Alamy Stock Photo

  • Work index: 81.6
  • Average working & commuting time for parents: 44.9 hours per week
  • Percentage of parents employed full-time: 69.4%
  • Percentage of parents not employed: 14.3%
  • Average number of children under 18: 1.95

Among all large metros, Minneapolis-St. Paul has the largest percentage of parents who are employed in some capacity. At the same time, parents in the Twin Cities also have an average of 1.95 children, which is higher than the national average.

The Twin Cities region is home to major employers including UnitedHealth Group, Best Buy, US Bank, 3M, U.S. Bancorp and General Mills. Minneapolis and St. Paul are located about 20 minutes away from each other, further expanding opportunities for parents to find work in either city (but also potentially lengthening the commute).

Methodology and full results

To identify the cities with the hardest-working parents, a composite score was calculated for each metro based on the following factors (all weighted equally), with higher scores indicating that parents work harder:

  • Average total working & commuting time for parents (raises the score)
  • Percentage of parents employed full-time (raises the score)
  • Percentage of parents not employed (lowers the score)
  • Average number of children under 18 (raises the score)

For the purpose of this analysis, parents were defined as any head of household, spouse or unmarried partner living in a family household with related children under 18. The percentage of parents not employed includes both unemployed parents and those not in the labor force. All statistics were derived from the U.S. Census Bureau 2017 American Community Survey Public Use Microdata Sample (PUMS).

Only metropolitan areas with at least 100,000 people were included in the analysis. Additionally, metro areas were grouped into the following cohorts based on population size:

  • Small metros: 100,000-350,000
  • Midsize metros: 350,000-1,000,000
  • Large: more than 1,000,000

Only large metros are included in the final list.

Related to this collection

Arizona Daily Star
  • Facebook
  • Twitter
  • Bluesky
  • YouTube
  • Instagram
  • Arizona Daily Star Store
  • This is Tucson
  • Saddlebag Notes
  • Tucson Festival of Books

Sites & Partners

  • E-edition
  • Classifieds
  • Events calendar
  • Careers @ Lee Enterprises
  • Careers @ Gannett
  • Online Features
  • Sponsored Blogs
  • Get Healthy

Services

  • Advertise with us
  • Register
  • Contact us
  • RSS feeds
  • Newsletters
  • Photo reprints
  • Subscriber services
  • Subscription FAQ
  • Licensing
  • Shopping
© Copyright 2026 Arizona Daily Star, PO Box 26887 Tucson, AZ 85726-6887
Terms of Use | Privacy Policy | Advertising Terms of Use | Do Not Sell My Info | Cookie Preferences
Powered by BLOX Content Management System from bloxdigital.com.
  • Notifications
  • Settings
You don't have any notifications.

Get up-to-the-minute news sent straight to your device.

Topics

News Alerts

Breaking News