 Photo Credit: Alamy Stock Photo
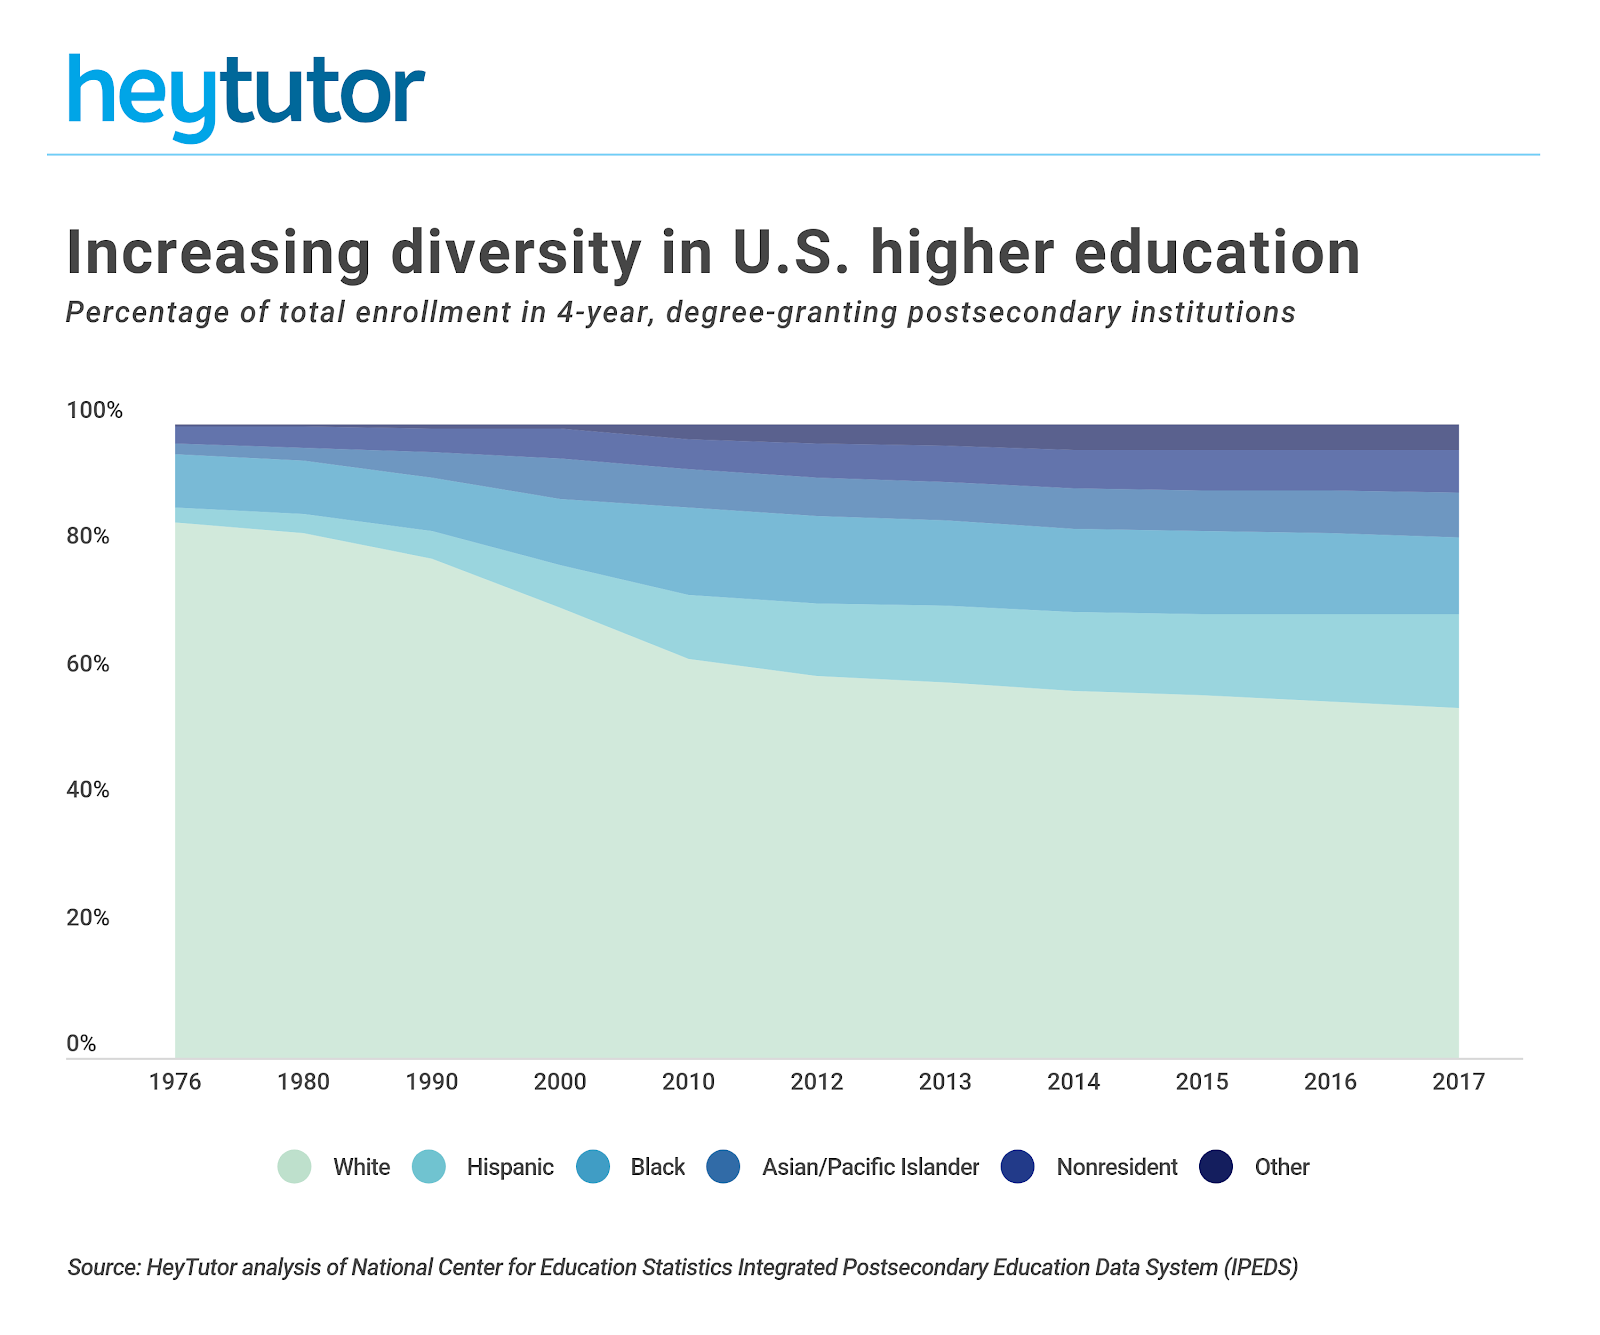
Diversity on college campuses has come a long way. Over the past 40 years, the percentage of nonwhite students enrolling in 4-year public and private colleges has steadily increased, with black and Hispanic students experiencing the largest gains. While racial demographics of 4-year college students are slowly starting to reflect the demographics of the U.S. population, a closer look at national data suggests that diversity is not evenly spread across the most selective colleges.
Data from the National Center for Education Statistics shows that in 1976, more than 80 percent of students at 4-year colleges were white. By 2017, that number had fallen to 55.3 percent. Across all 4-year postsecondary institutions, currently 12.3 percent of students are black, 14.7 percent are Hispanic, 6.7 percent are Asian or Pacific Islander, and 4.2 percent are another race. In addition, 6.6 percent of students at 4-year colleges are nonresidents born outside of the U.S.
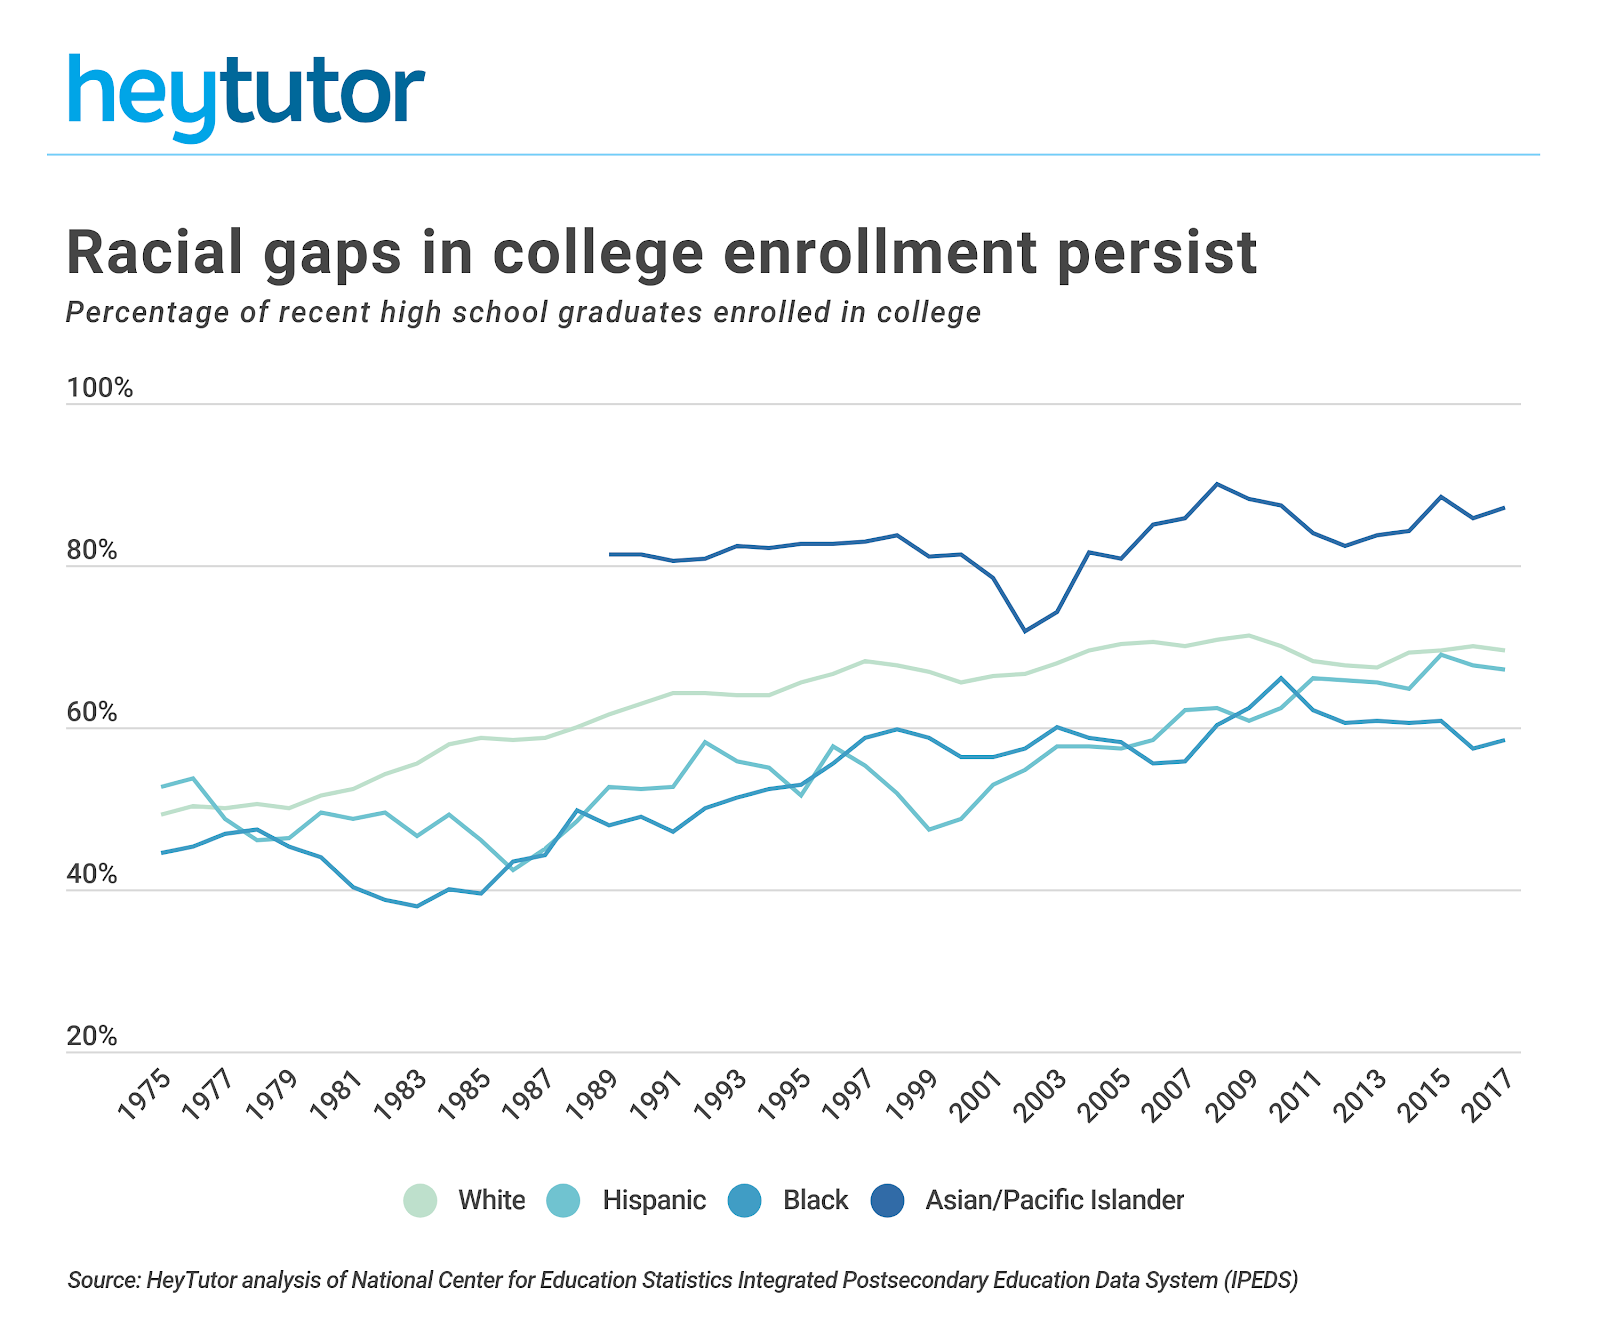
Even though undergraduate enrollment has increased across major demographic groups, racial gaps still persist. According to data from the National Center for Education Statistics, the percentage of recent black high school graduates enrolled in college trails that of whites by more than 10 percentage points. The gap is even larger between black students and Asian students. As of 2017, 87 percent of Asian students who recently completed high school enrolled in college, compared to 58.4 percent of black high school graduates. Interestingly, after decades of increasing college enrollment, Hispanic high school students are about as likely to attend college as white students.
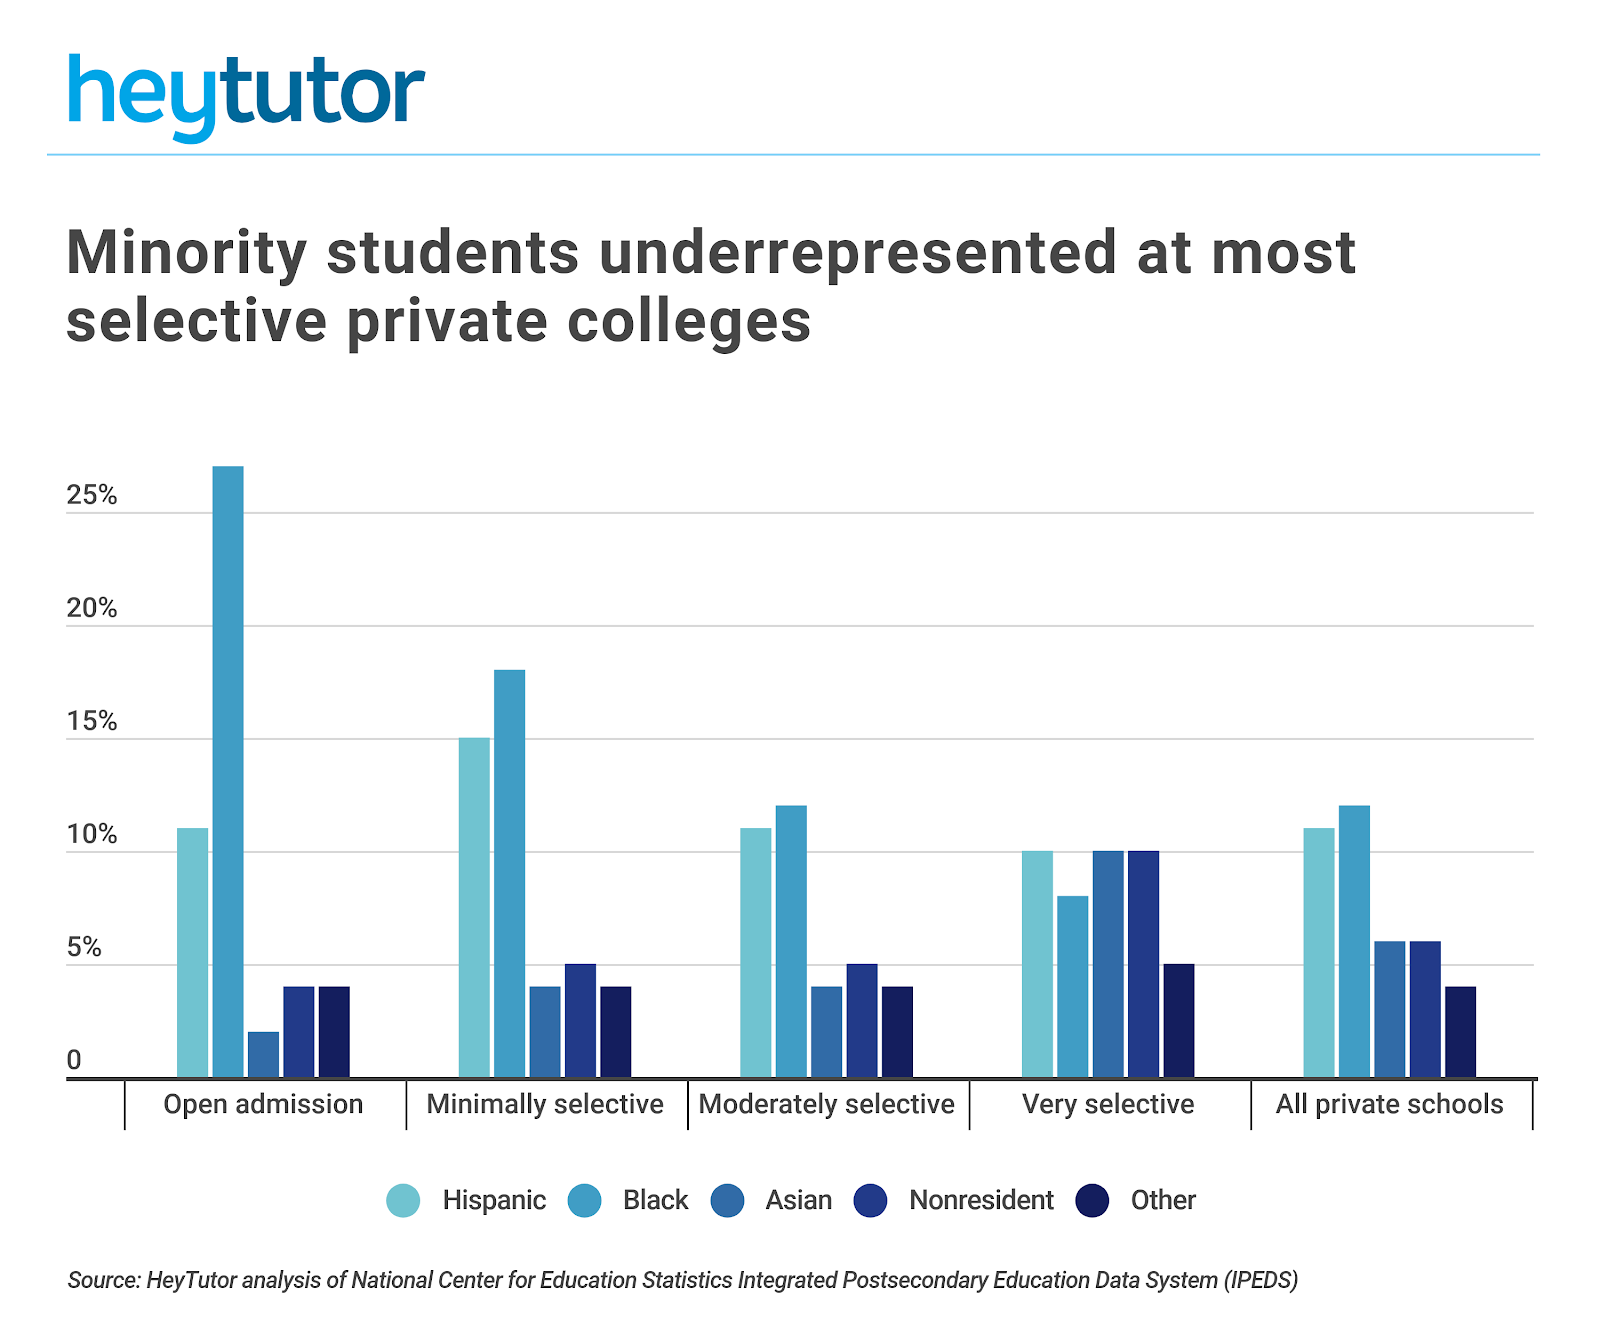
Despite increases in enrollment rates, black and Hispanic students remain underrepresented at very selective private schools. In fact, research conducted by The New York Times found that these minority groups are even more underrepresented at top universities now than they were 35 years ago.
Improvements in enrollment statistics for black and Hispanic students has largely been the result of these students attending less selective schools, which, perhaps counterintuitively, are often the most expensive for low-income students. A total of 38 percent of students at open admission private institutions are black or Hispanic, compared to just 18 percent at very selective universities. On the other hand, Asians and nonresidents together account for only 6 percent of students at open admission schools, yet 20 percent of students at very selective schools.
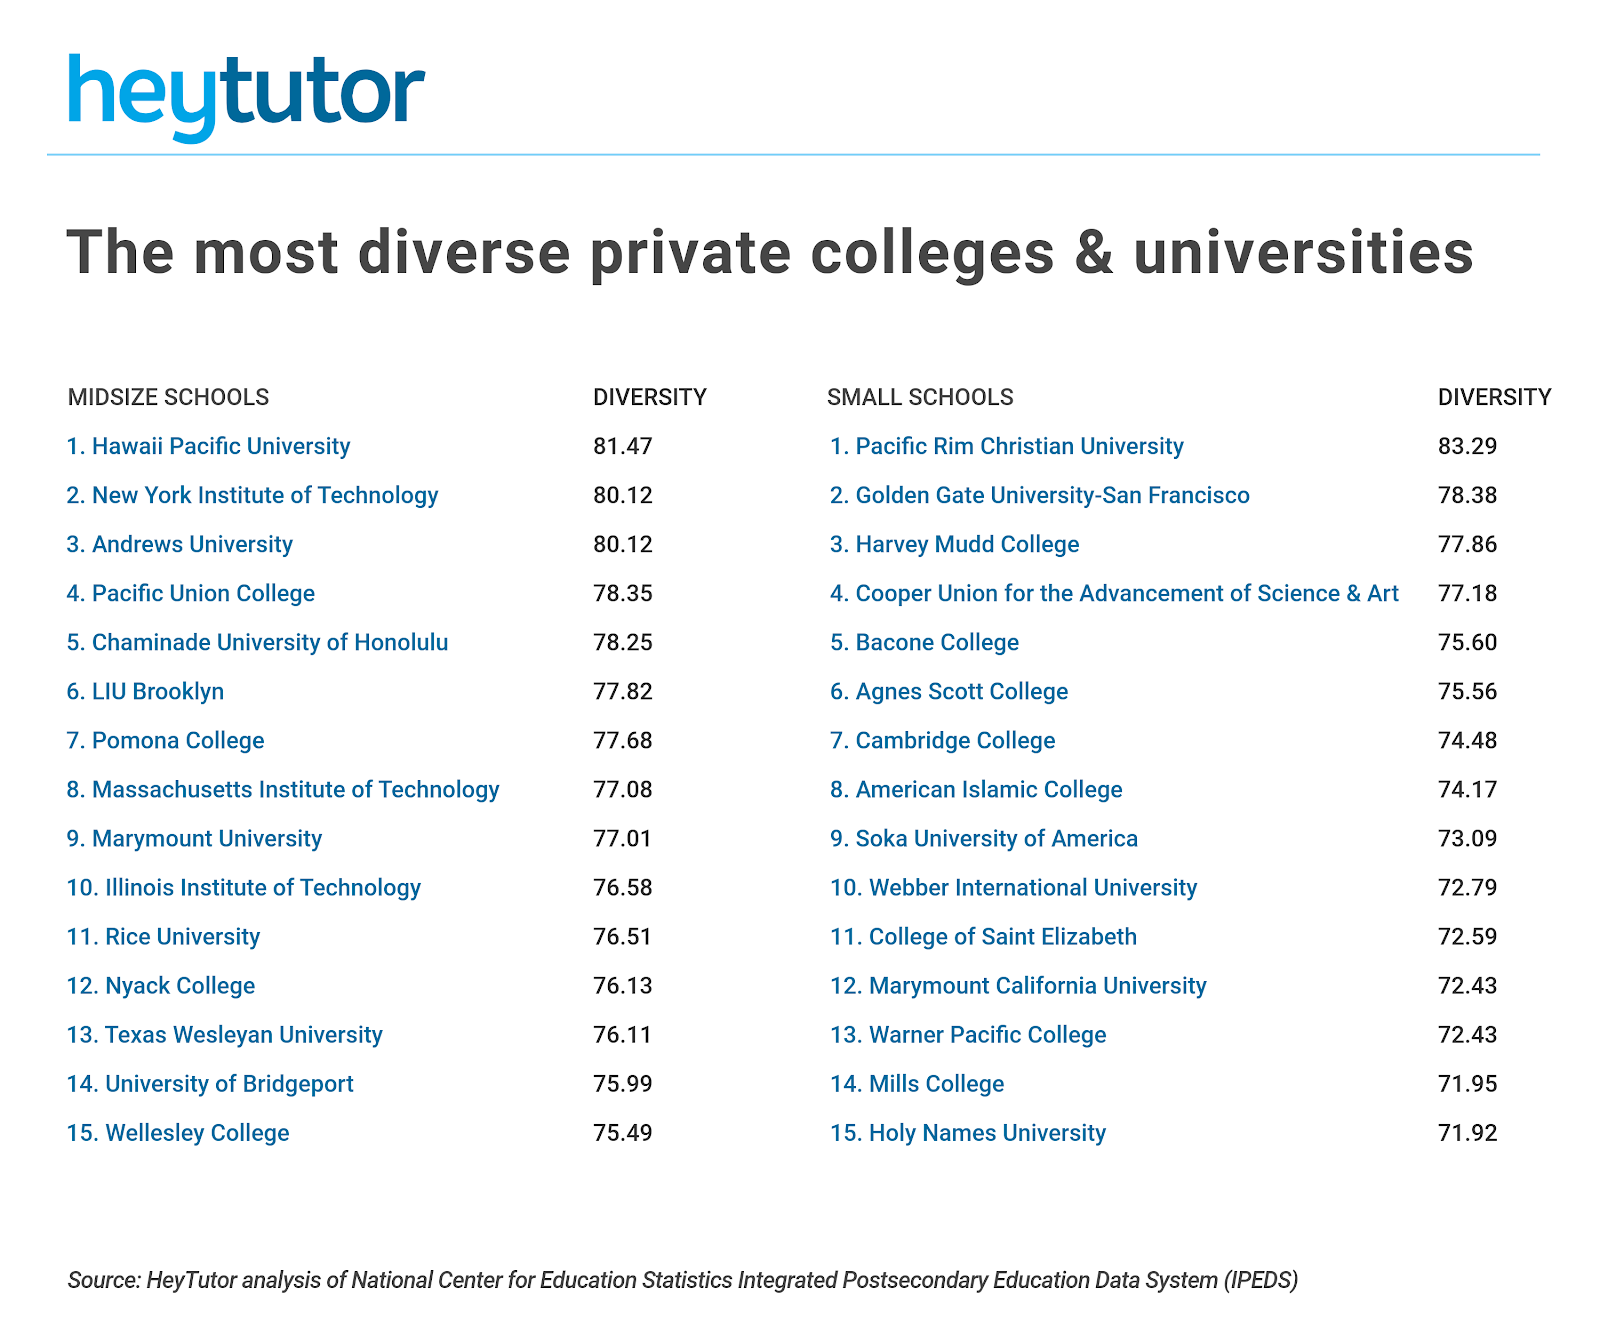
With these trends in mind, researchers at HeyTutor wanted to determine which colleges in the U.S. are the most diverse. To find America’s most diverse private colleges, the team analyzed data from the National Center for Education Statistics (NCES) Integrated Postsecondary Education Data System (IPEDS). Its researchers looked at fall 2017 undergraduate enrollment for more than 900 four-year, private, degree-granting institutions. Specialty-focus schools and online schools were excluded.
HeyTutor examined race/ethnicity data and calculated the Simpson’s Index of Diversity for each school. The diversity index can be interpreted as the probability that any two students chosen at random will belong to separate racial/ethnic groups. For the diversity index, students that are not U.S. citizens or nationals (nonresidents) are considered a separate group. Additionally, HeyTutor grouped schools into the following cohorts based on size:
- Large schools: more than 5,000 students
- Midsize schools: 1,000 to 4,999 students
- Small schools: fewer than 1,000 students
Across all private four-year universities, the diversity index ranges from a high of 83.29 to a low of 0.00. Schools at the upper end of the diversity index have a more uniform distribution of students across different racial/ethnic groups. On the other hand, schools with a low diversity index have a single group that accounts for most (or all) of the student body.
The diversity index of total undergraduate enrollment across all four-year, private, not-for-profit universities is 59.86, based on the following racial/ethnic breakdown: white (60.5 percent), Hispanic (11.3 percent), black (11.5 percent), Asian (5.9 percent), nonresident (6.4 percent), and other races (4.3 percent).
Interestingly, the moderately selective cohort of schools is the least diverse of any school grouping. Schools in the open admission, minimally selective, and very selective groups have similar diversity indices; however, their demographic compositions are all quite different.
Here are the most diverse private universities in the U.S.