

 Photo Credit: Marcio Silva / Alamy Stock Photo
Being that millennials now make up America’s largest generation, what these young adults choose to do with their money is a hot topic of conversation. A report by Fidelity Investments that suggested 35-year-olds should have twice their salary saved prompted outrage on Twitter from a crowd of angry (and presumably financially-strapped) millennials. On the other hand, it’s been reported that millennials are generally good at saving, but bad at investing. And of course, there’s the infamous avocado toast hypothesis, in which millionaire Tim Gurner asserted that millennials would be in better positions to buy homes if they stopped buying $19 smashed avocados and $4 coffees.
In order to take a more objective look at where millennials are putting their hard-earned dollars and how that compares to previous generations, researchers at Credit Sesame, an online credit management platform, analyzed current and historical data from the Federal Reserve Survey of Consumer Finances. Specifically, Credit Sesame looked at how millennial household finances in 2016 compared to those of Generation X in 2001 (when Gen Xers were the same age as millennials in 2016). For the purposes of this study, millennial households are defined as those with a head of household between the ages of 20 and 35 in 2016, while Generation X households are defined as those with a head of household between the ages of 20 and 35 in 2001. All dollar amounts presented are inflation adjusted to 2016. Here’s what Credit Sesame found:
Takeaways:
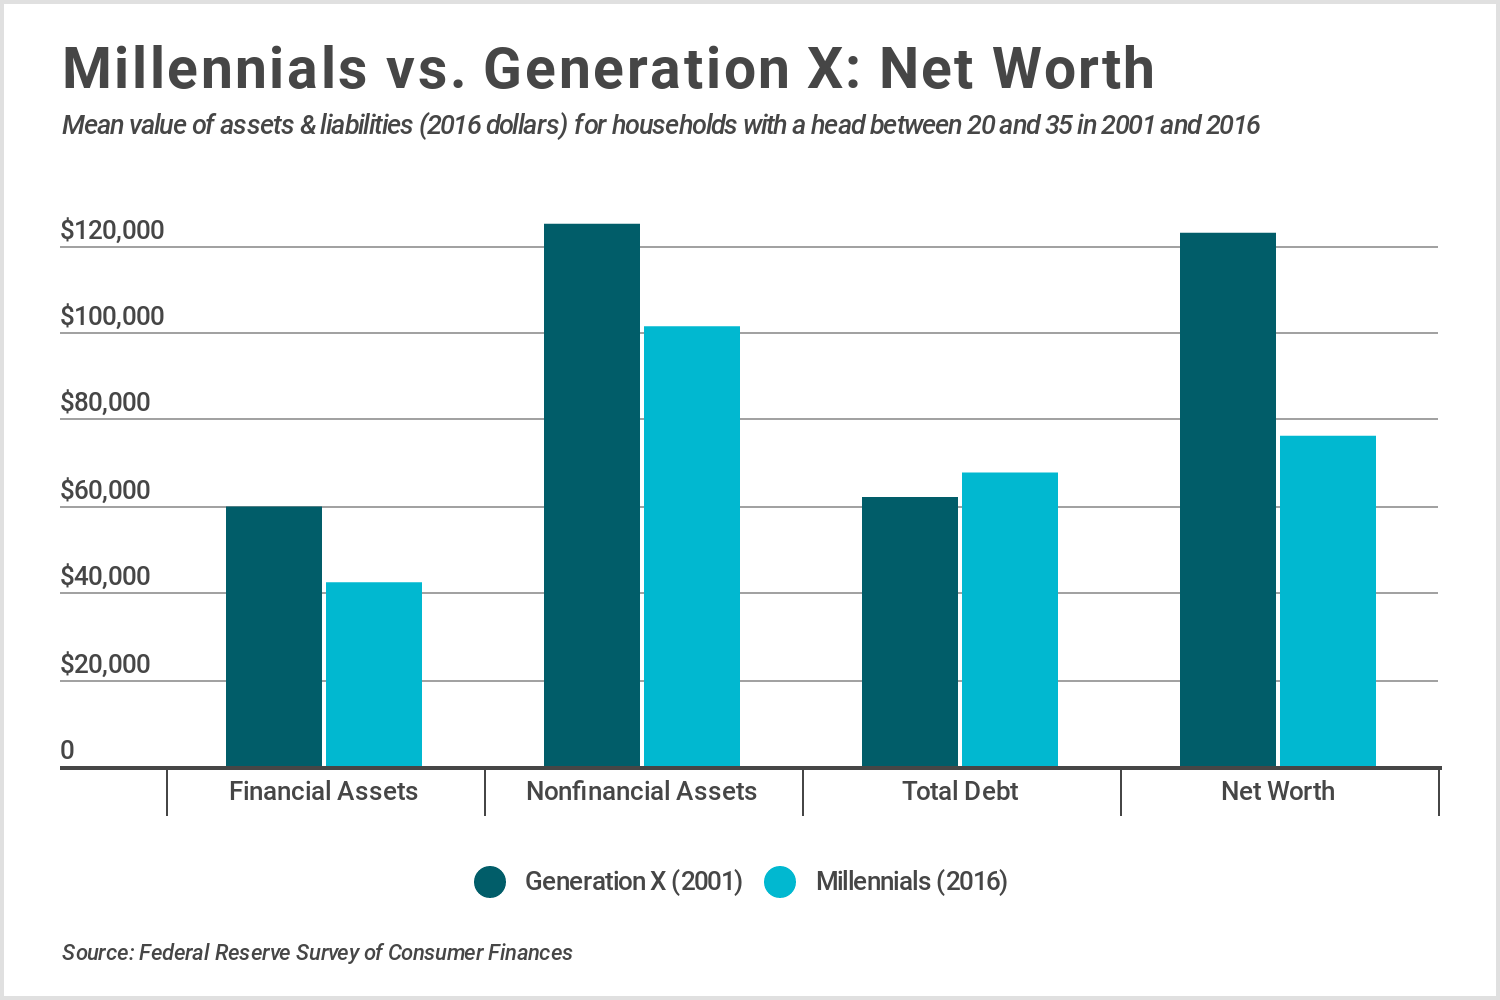
- Compared to Generation X households, millennial households held approximately 30 percent less value in financial assets. The decline was largely the result of millennials holding less value in stocks and cash value life insurance.
- In 2016, millennial households held 19 percent less value in nonfinancial assets than did Generation X households in 2001. Most of the reduction occurred as a result of millennials holding less business equity than Gen Xers, but declining homeownership was also a factor.
- Millennials held slightly more debt than Generation X ($67,635 vs. $62,025). While millennials held less mortgage and credit card debt, mounting student loan debt more than offset those differences.
- Overall, the average net worth of millennial households was 38 percent lower than that of the preceding generation at the same age. The average net worth for millennial households was $76,100 in 2016 compared to $122,900 in 2001 for Generation X.
For a more in-depth look at how millennials compare to Generation X across their financial assets, nonfinancial assets, and debt, continue reading below.
 Photo Credit: Credit Sesame
 Photo Credit: Credit Sesame
 Photo Credit: Credit Sesame
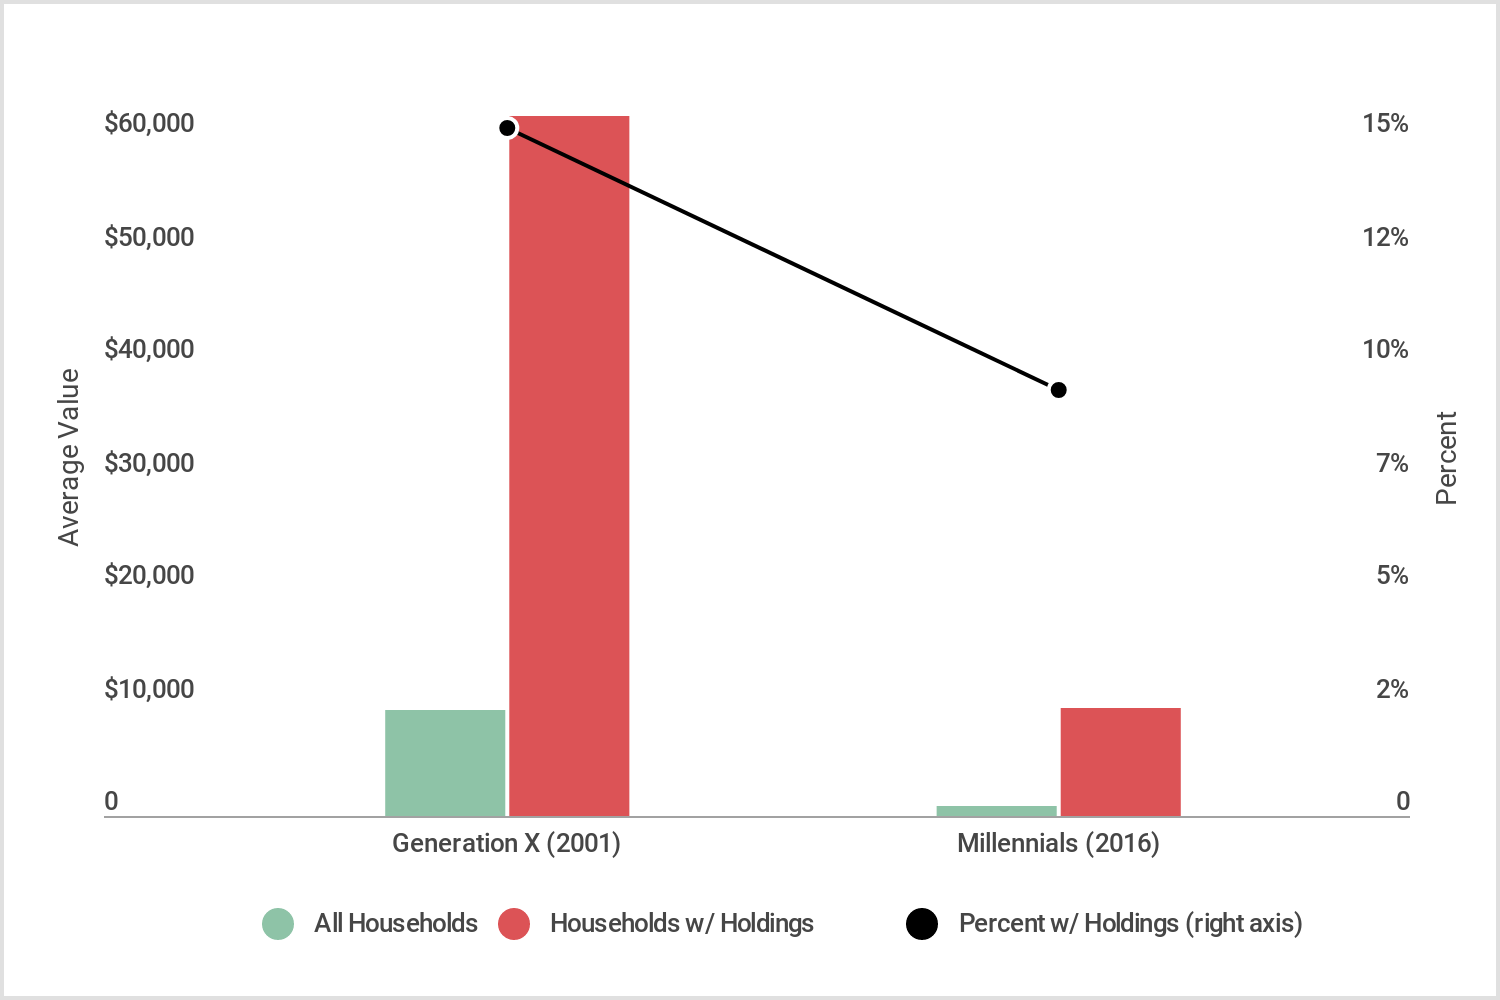 Photo Credit: Credit Sesame
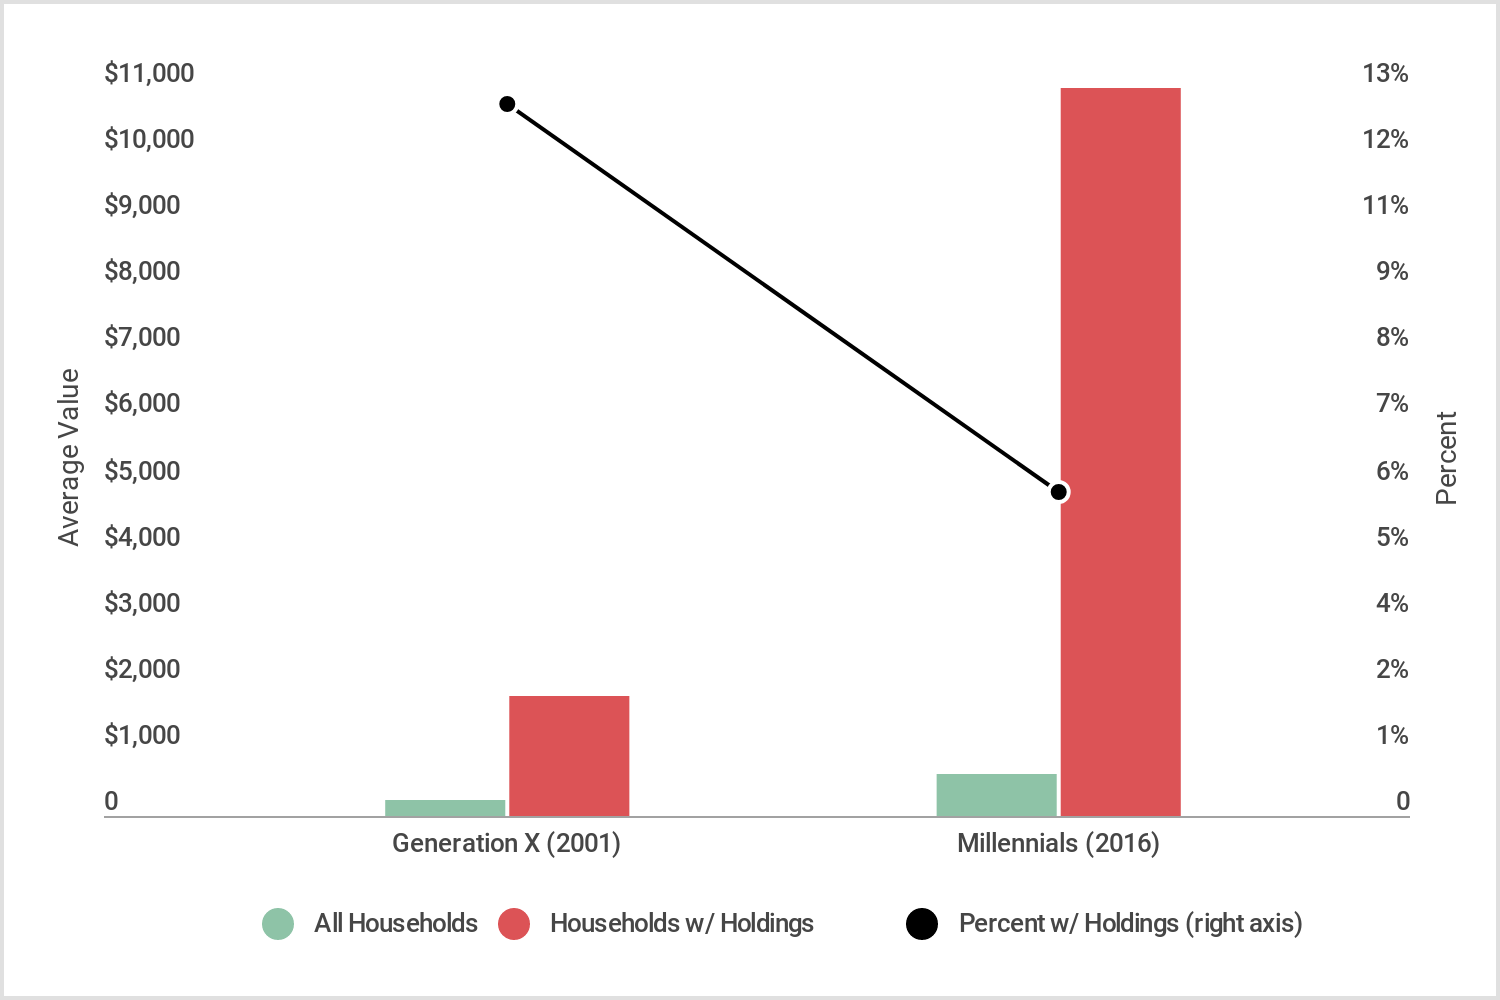 Photo Credit: Credit Sesame
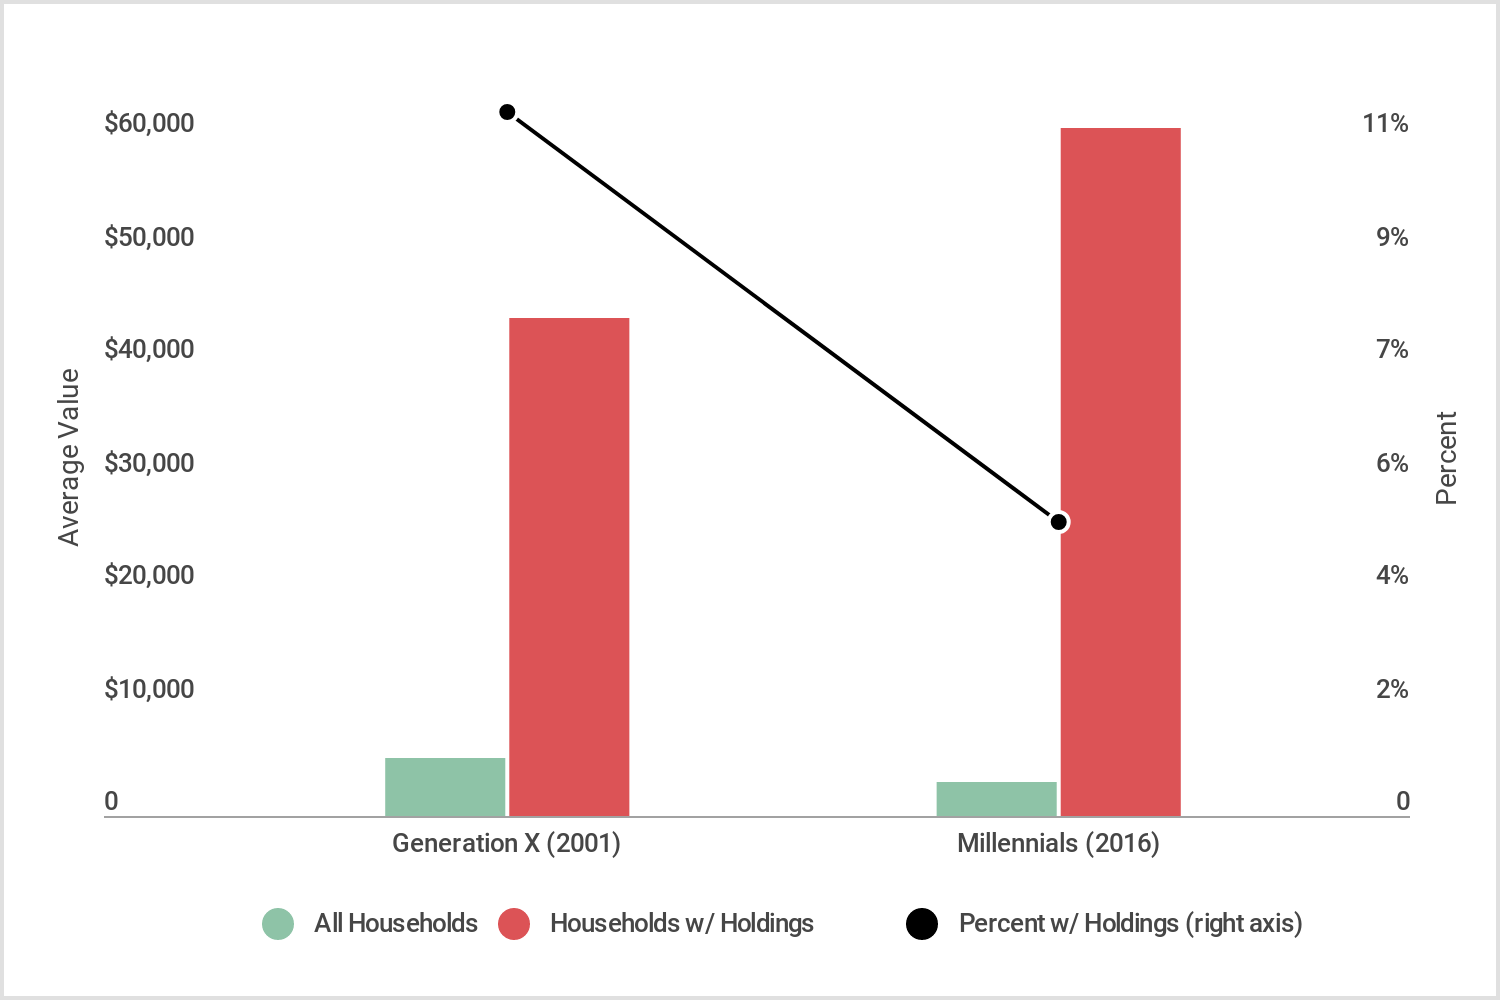 Photo Credit: Credit Sesame
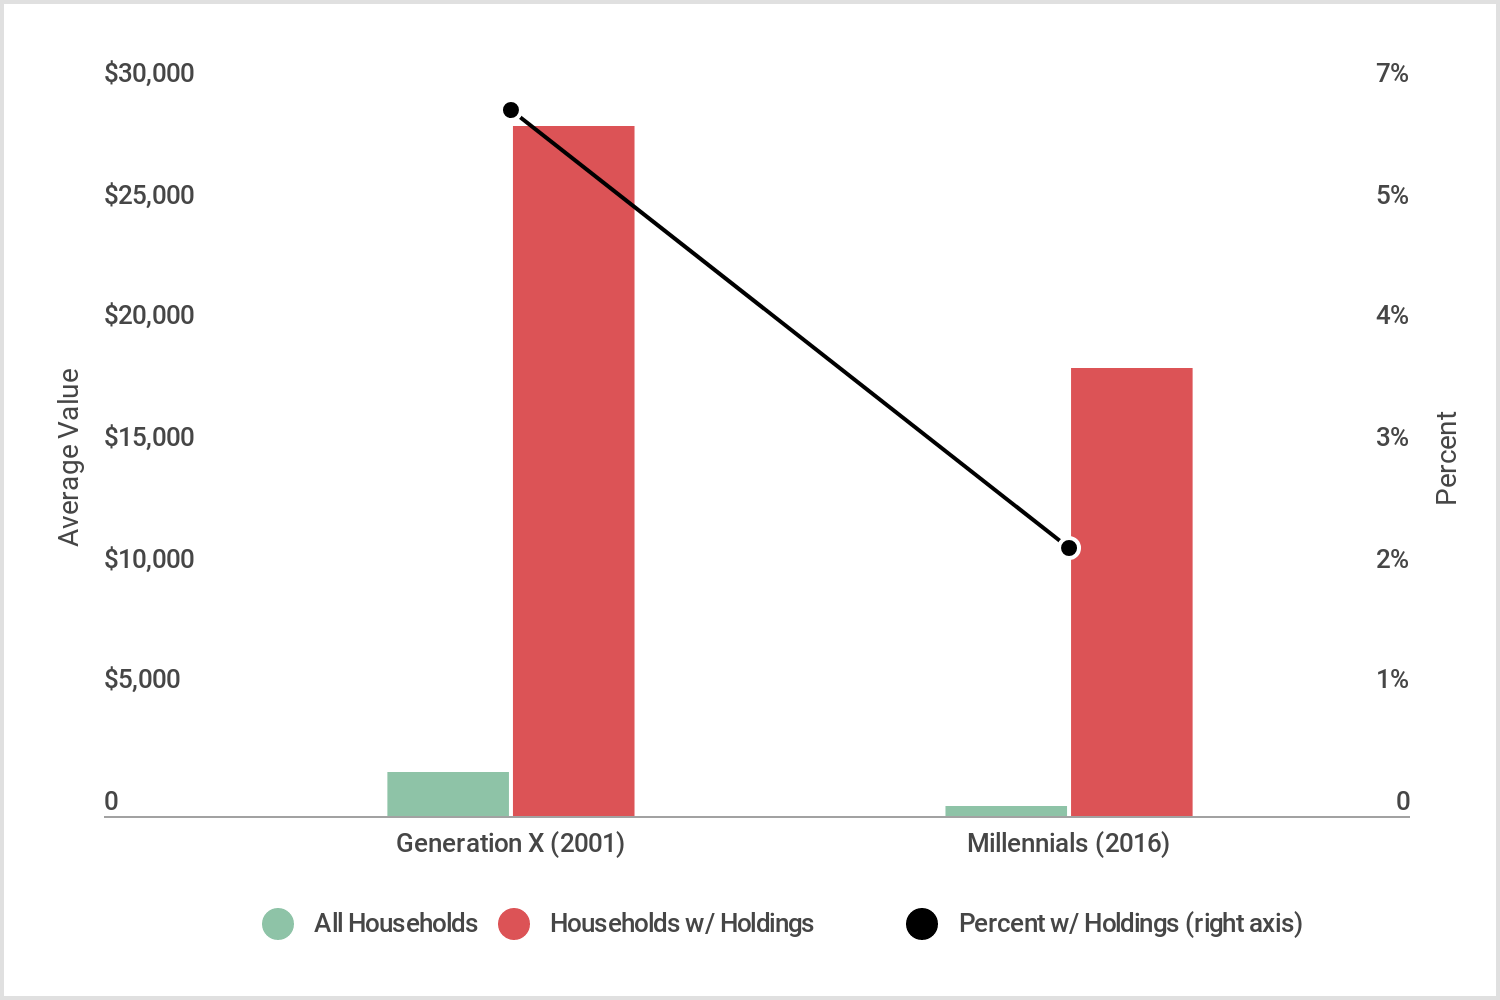 Photo Credit: Credit Sesame
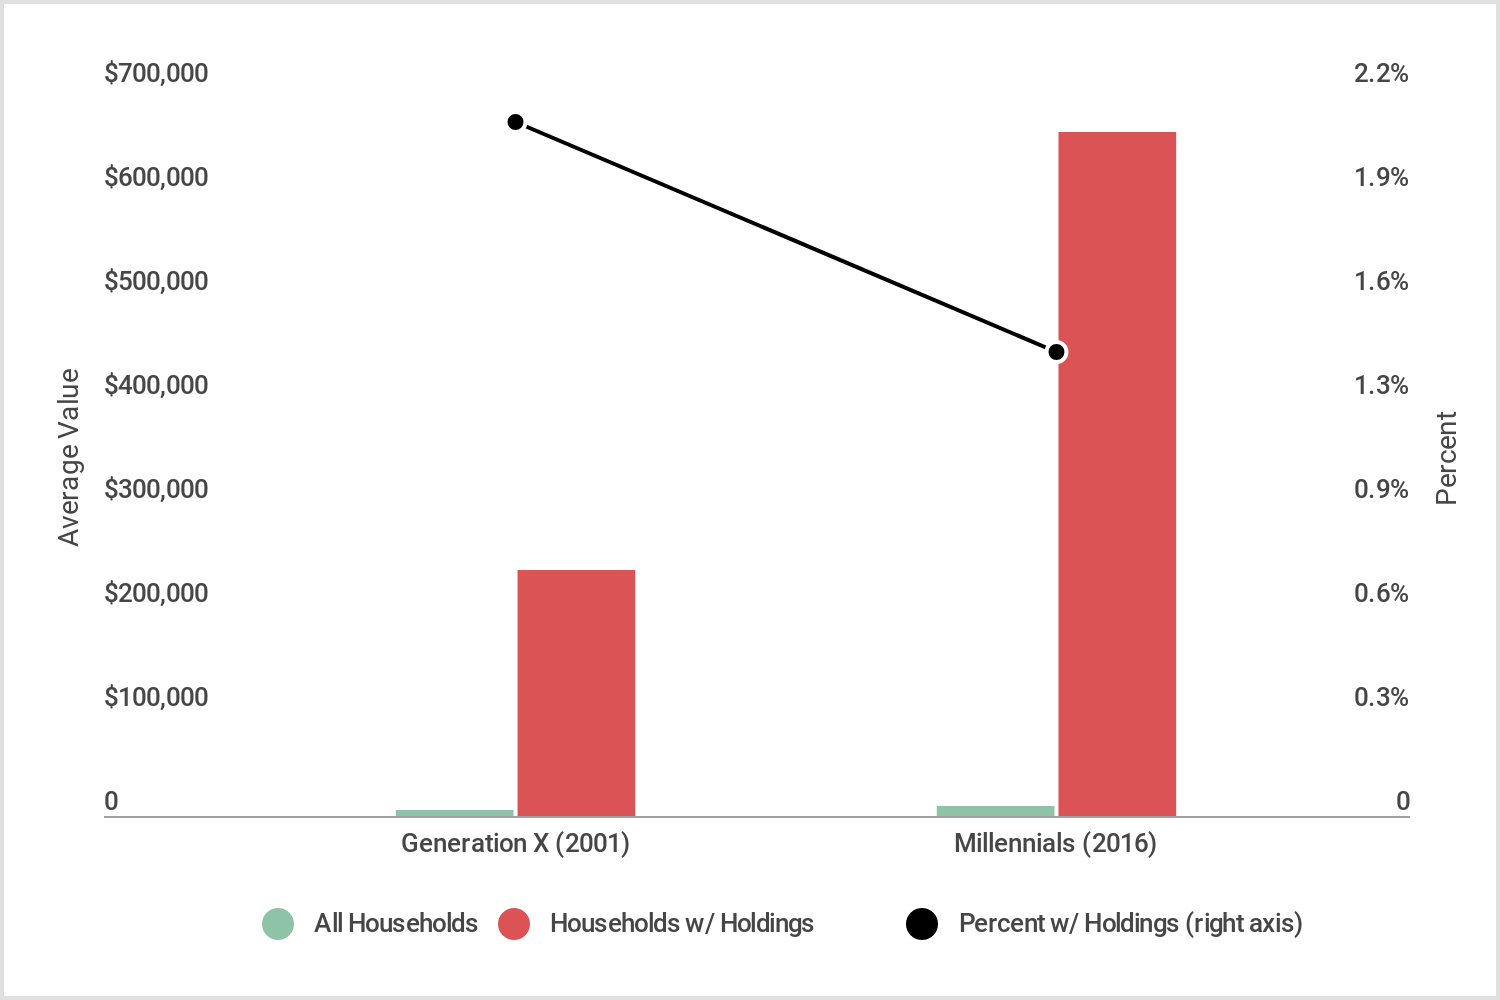 Photo Credit: Credit Sesame
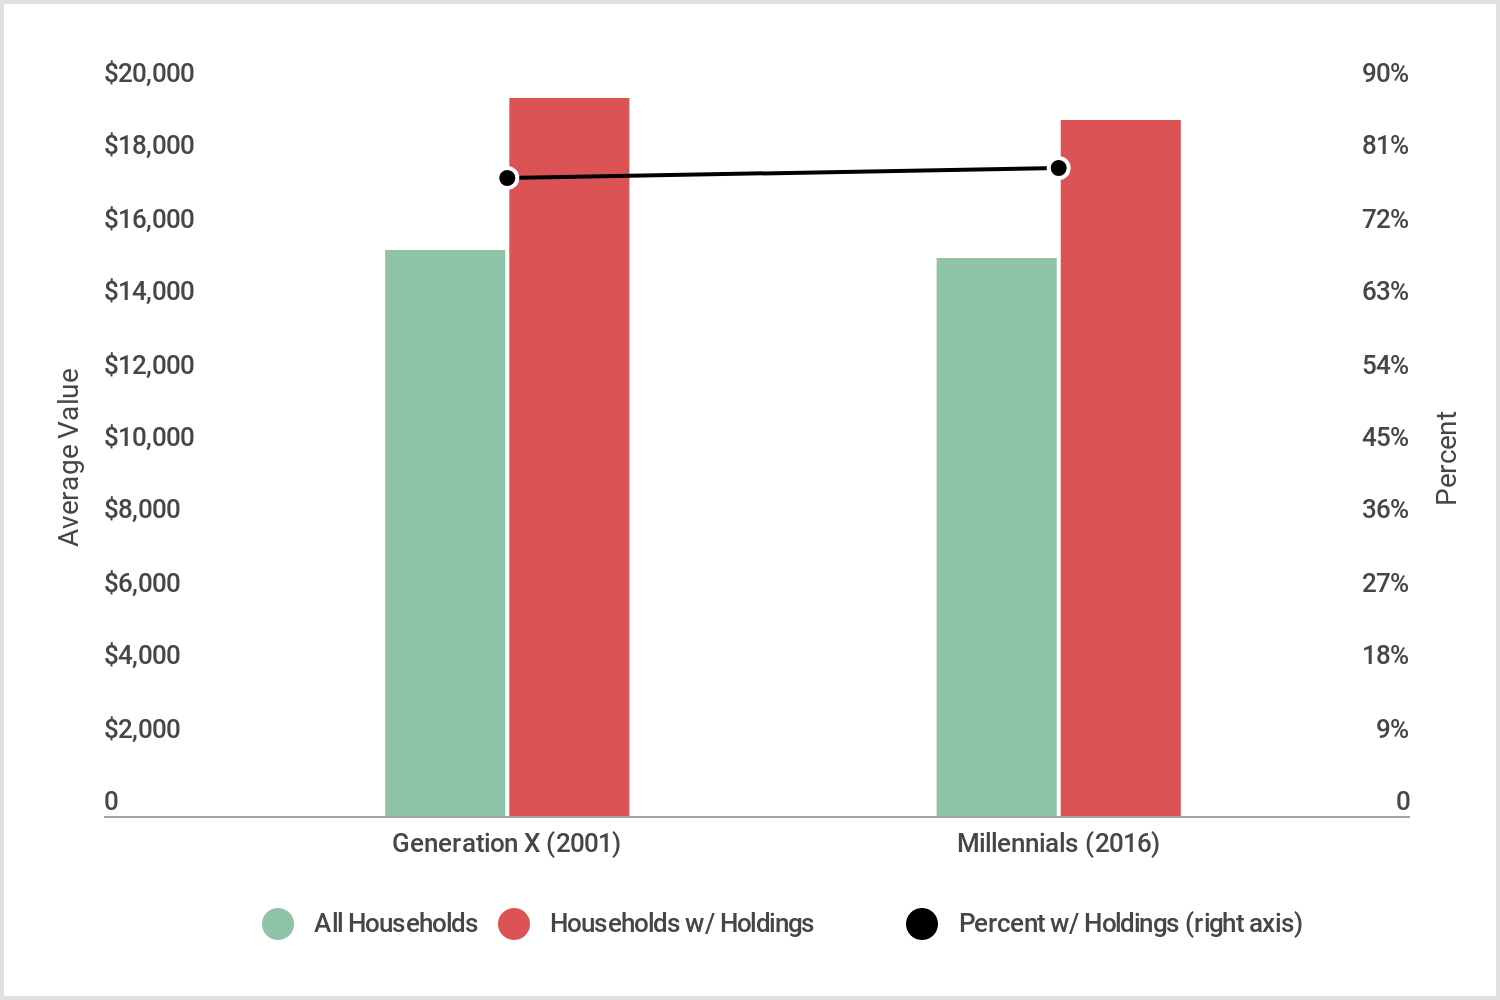 Photo Credit: Credit Sesame
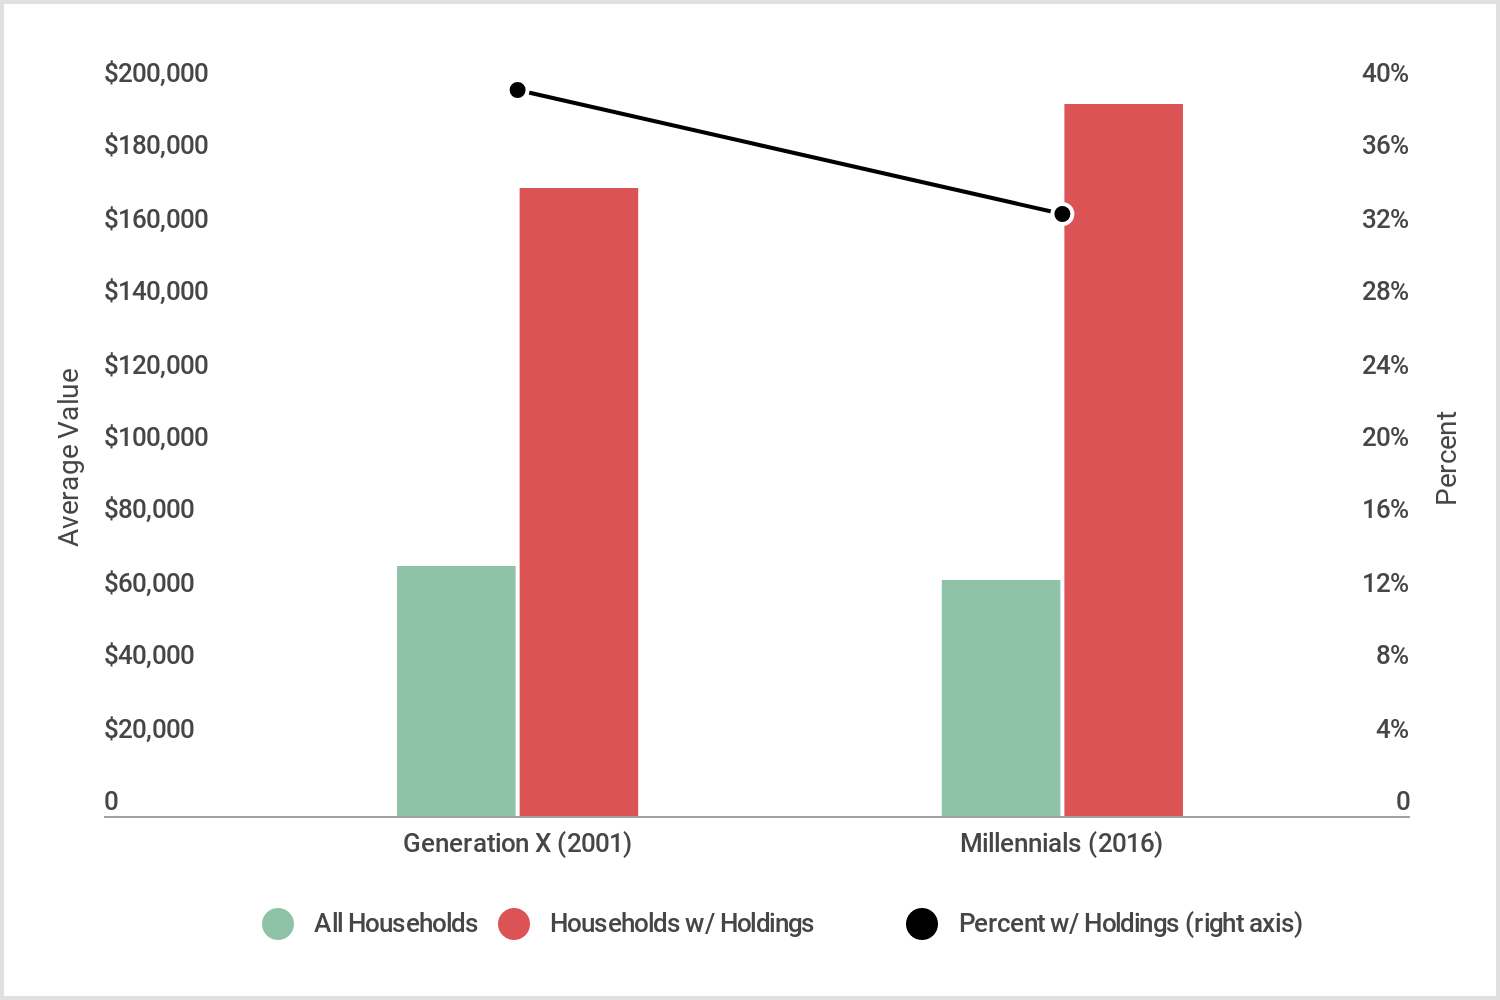 Photo Credit: Credit Sesame
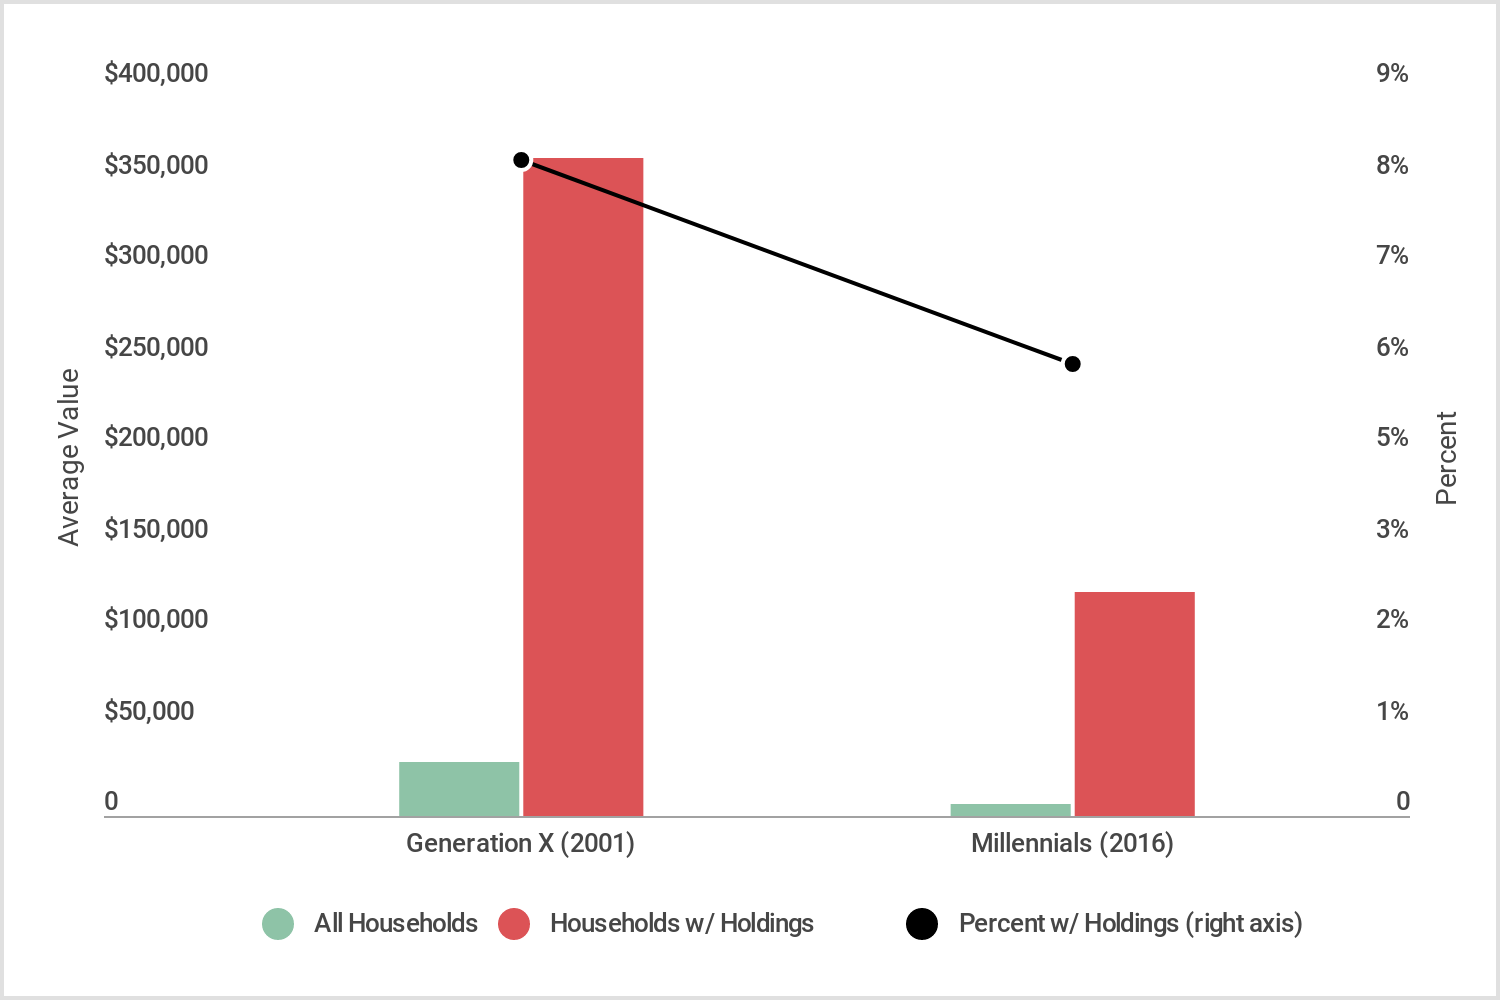 Photo Credit: Credit Sesame
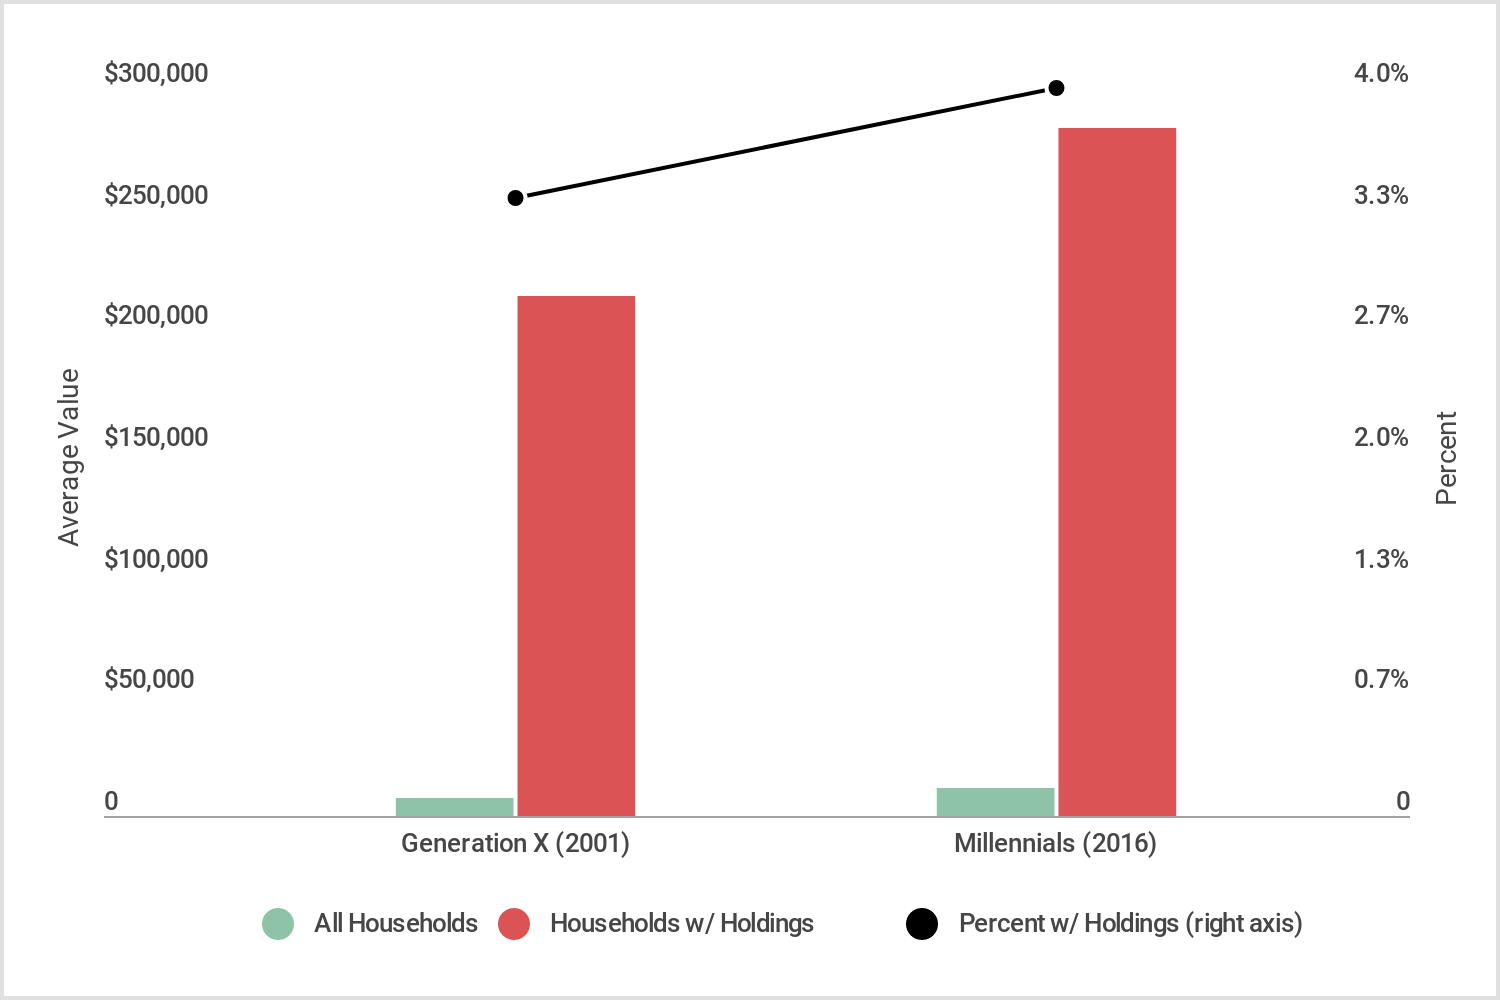 Photo Credit: Credit Sesame
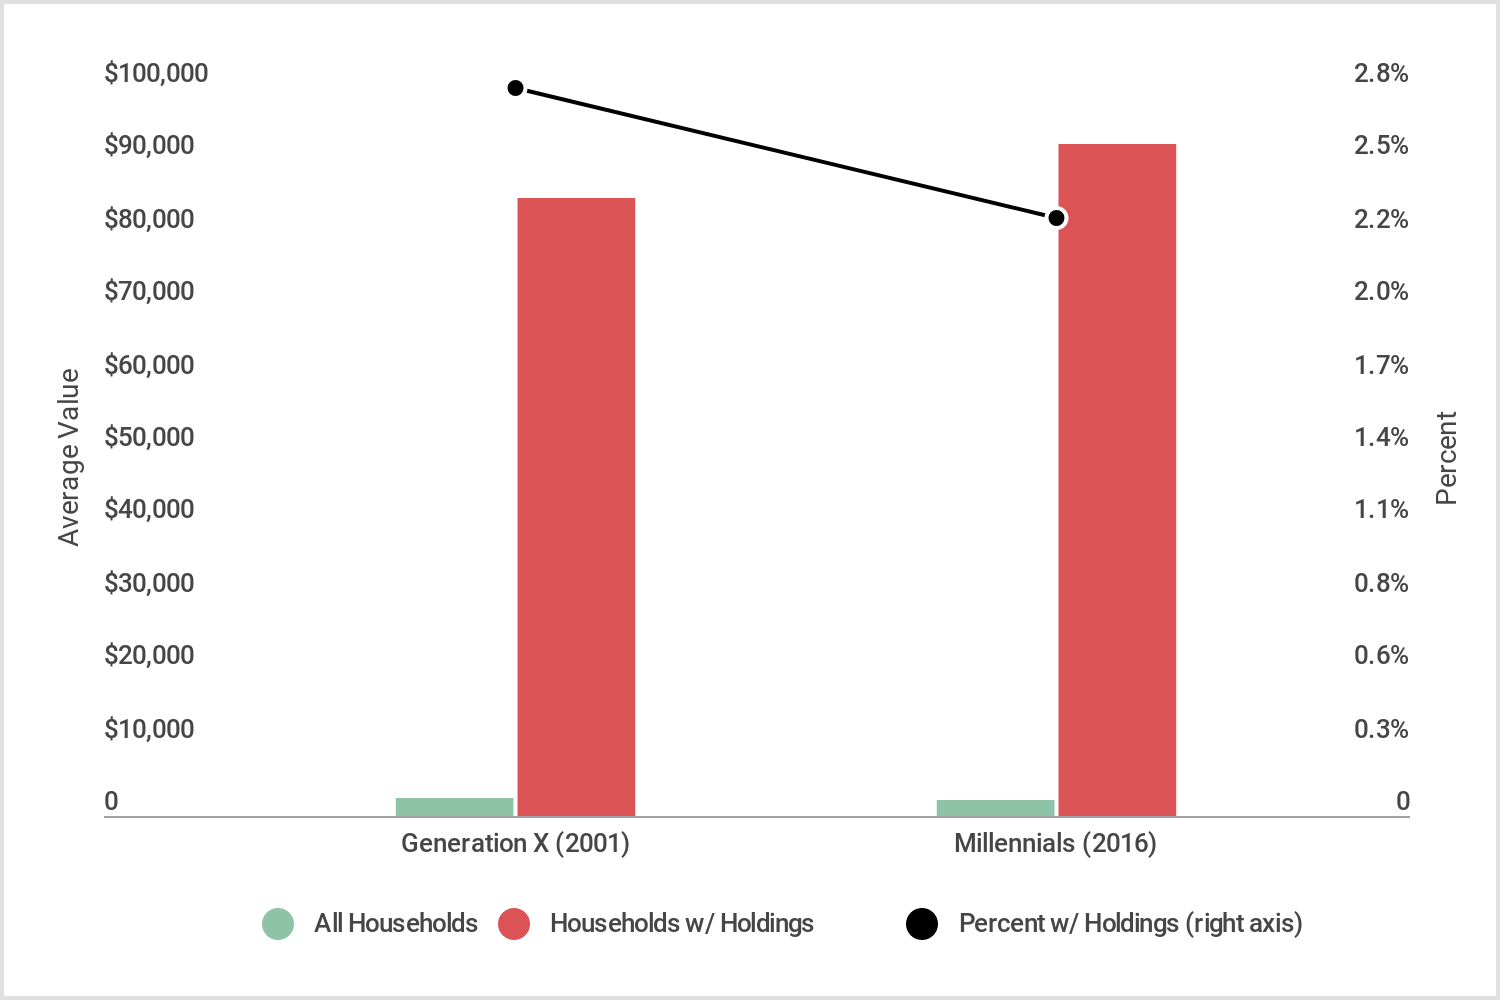 Photo Credit: Credit Sesame
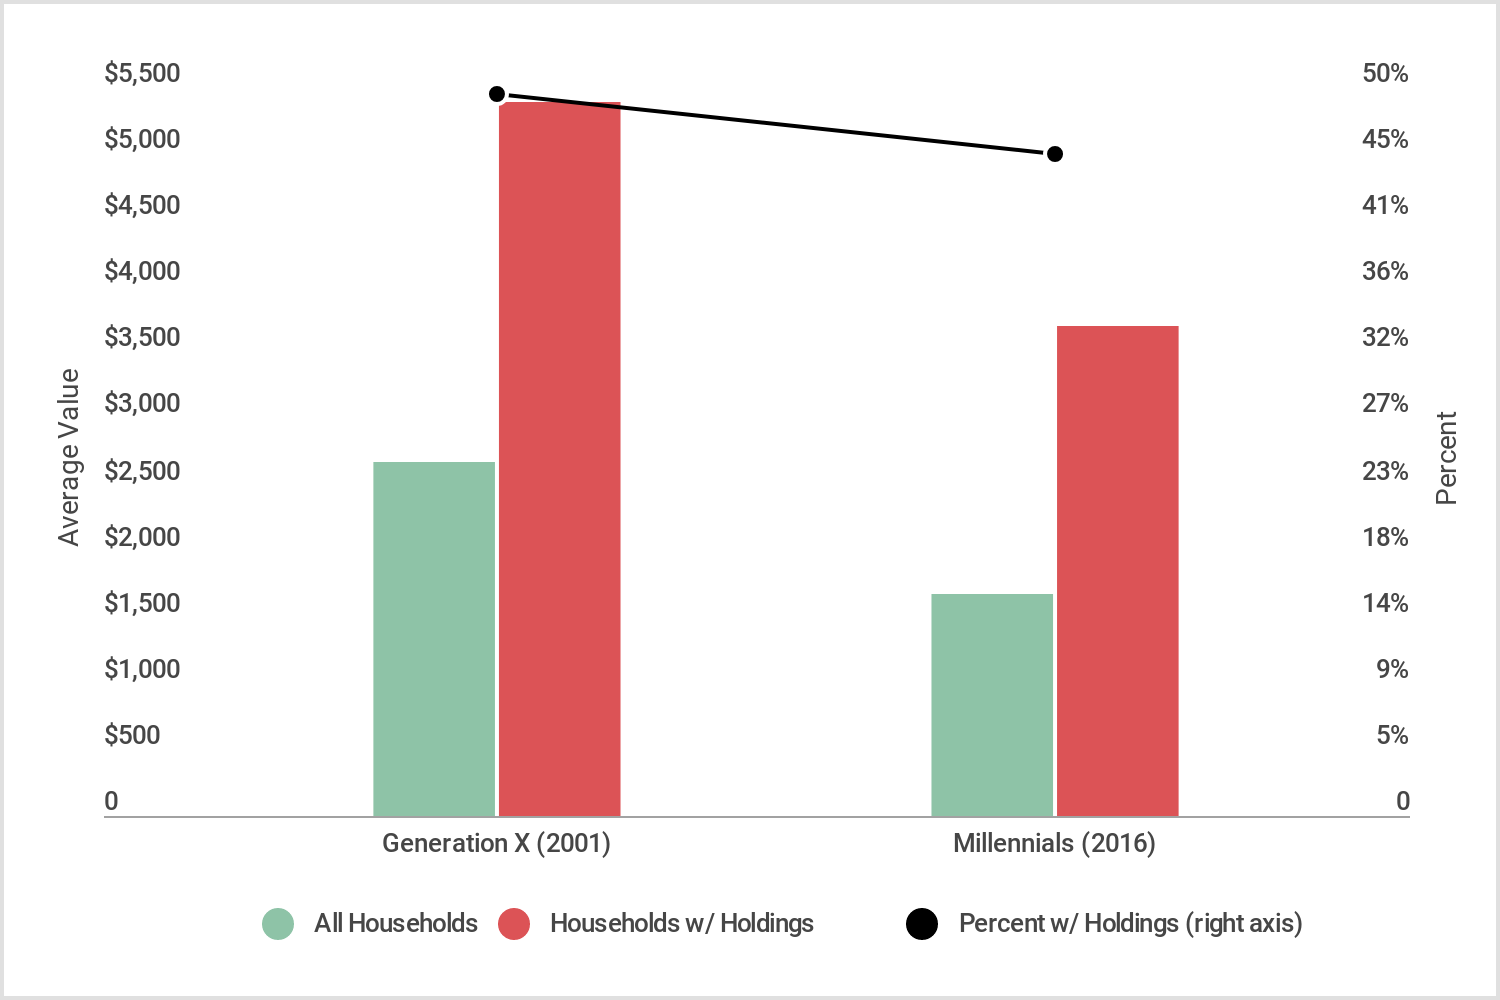 Photo Credit: Credit Sesame
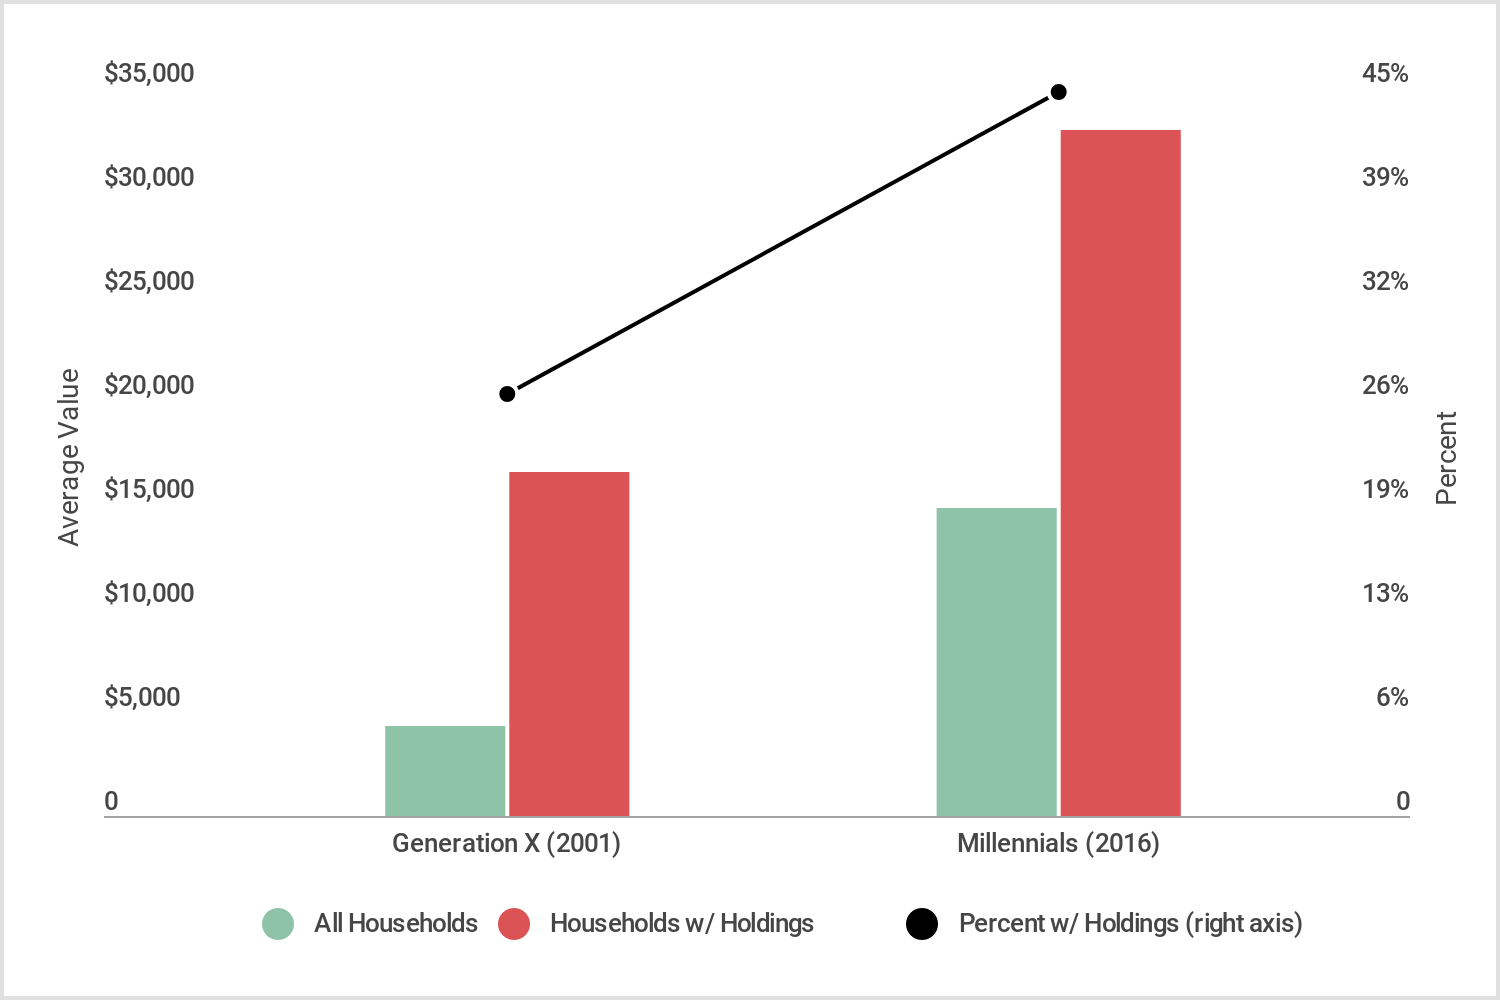 Photo Credit: Credit Sesame
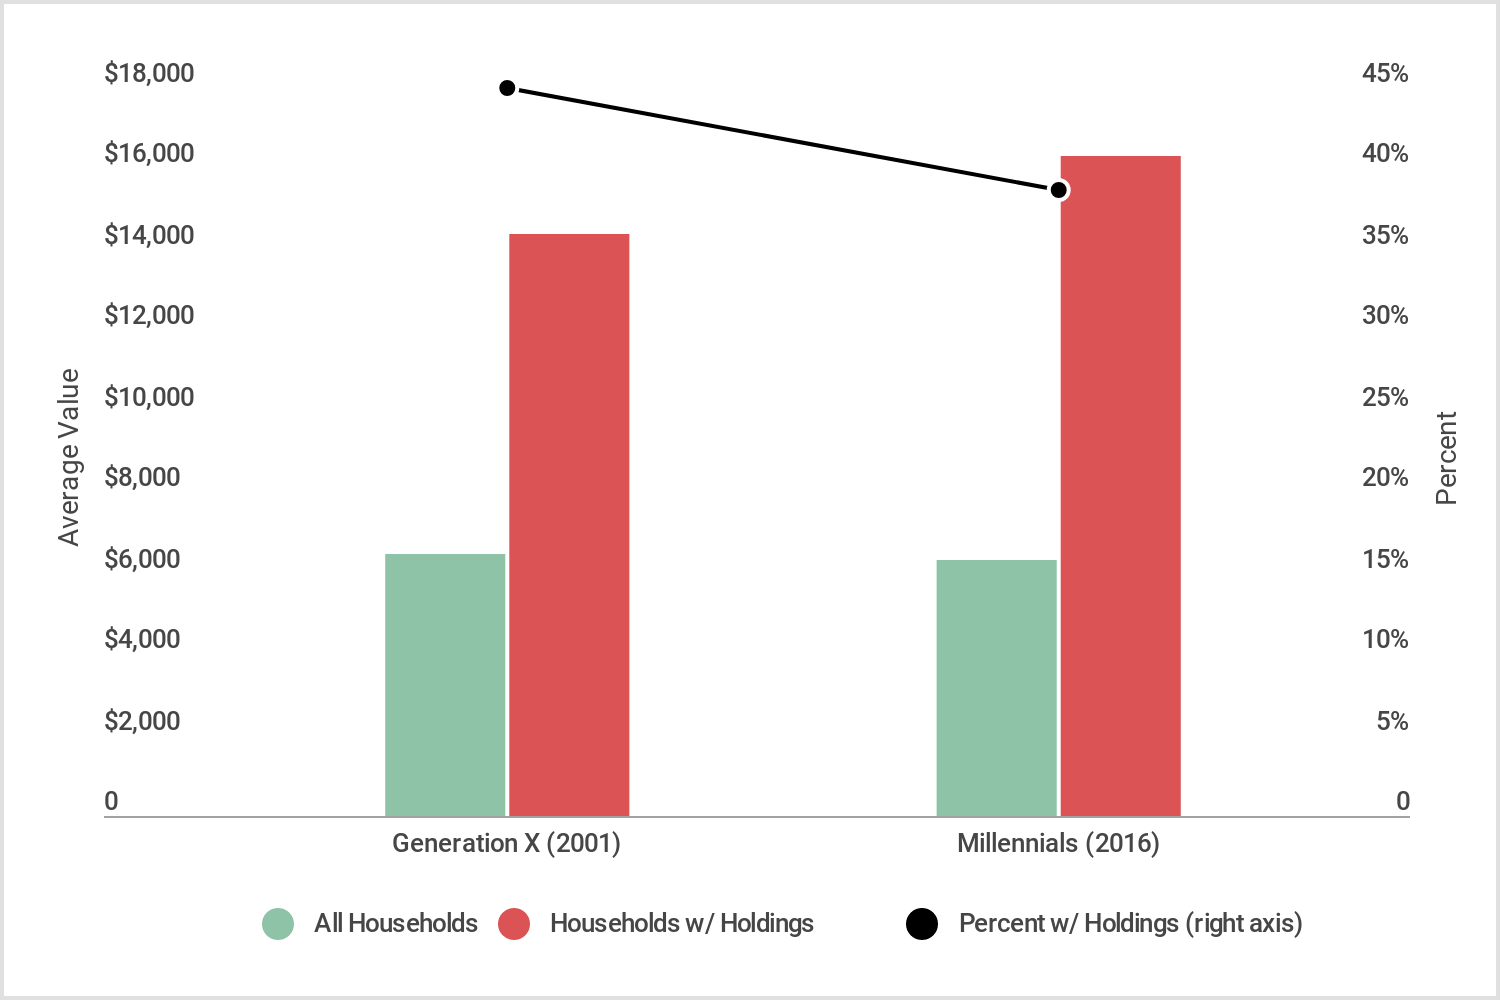 Photo Credit: Credit Sesame
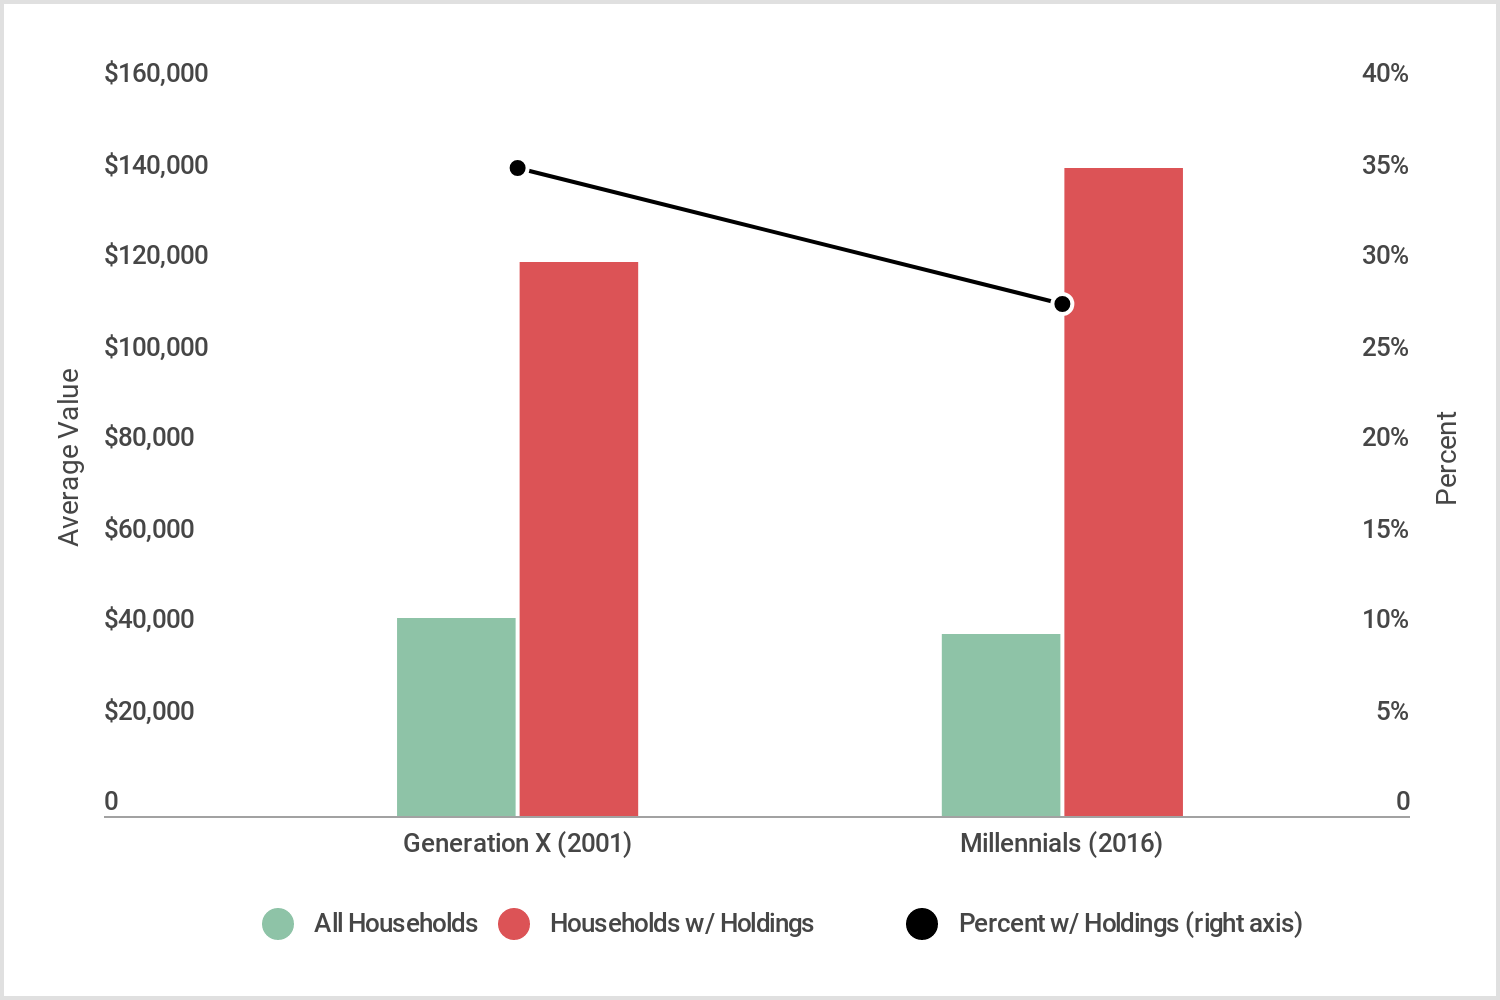 Photo Credit: Credit Sesame
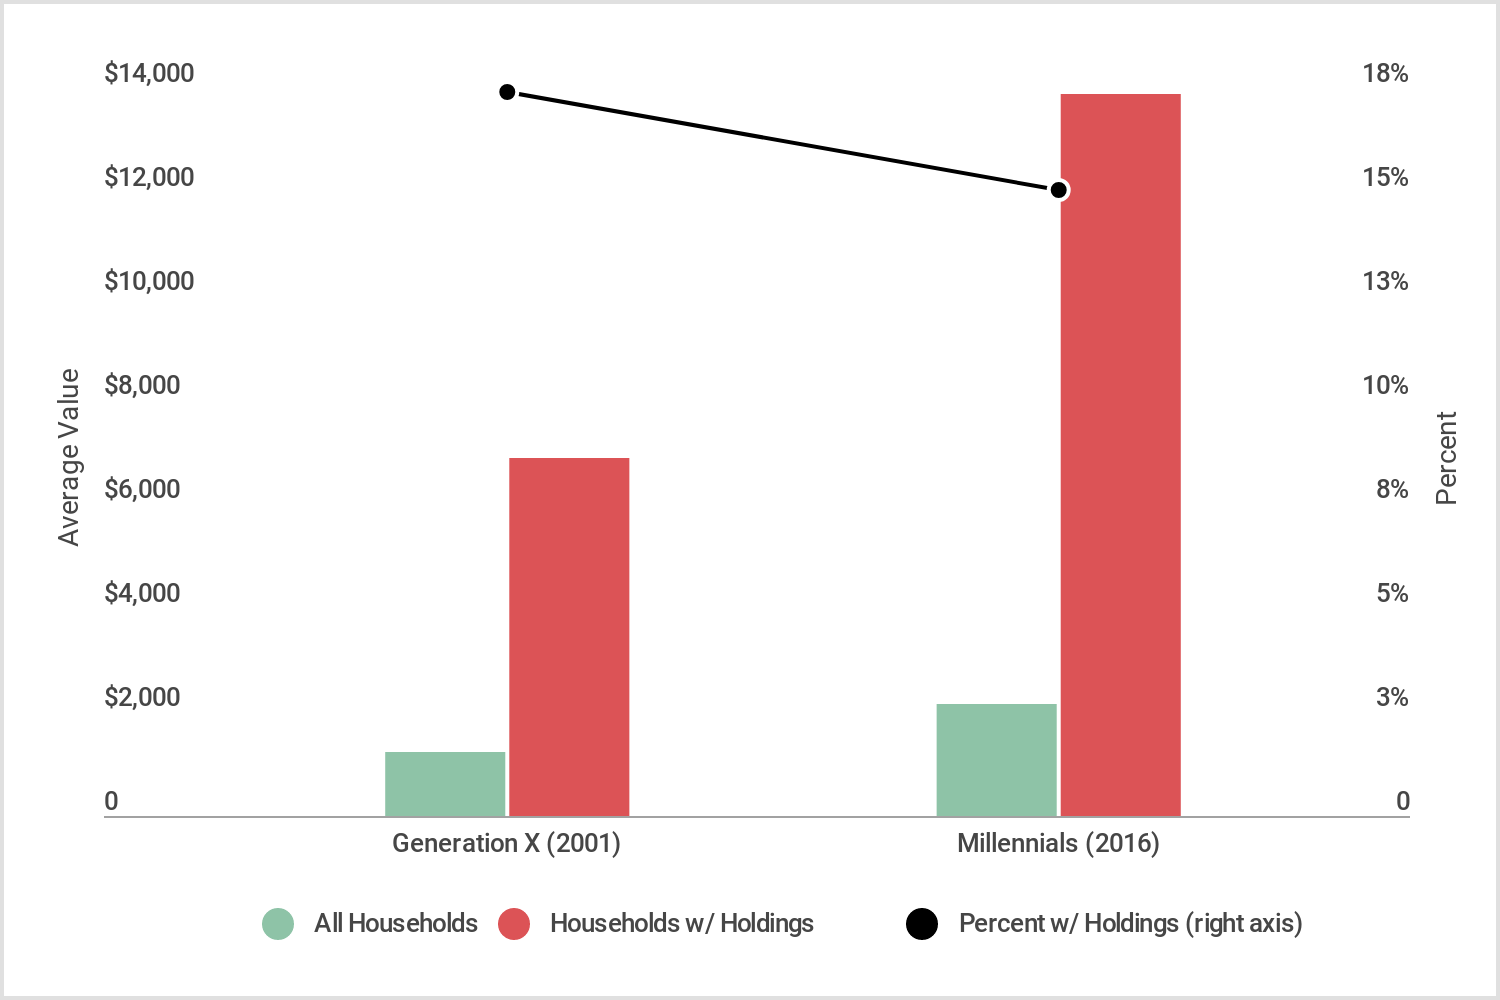 Photo Credit: Credit Sesame
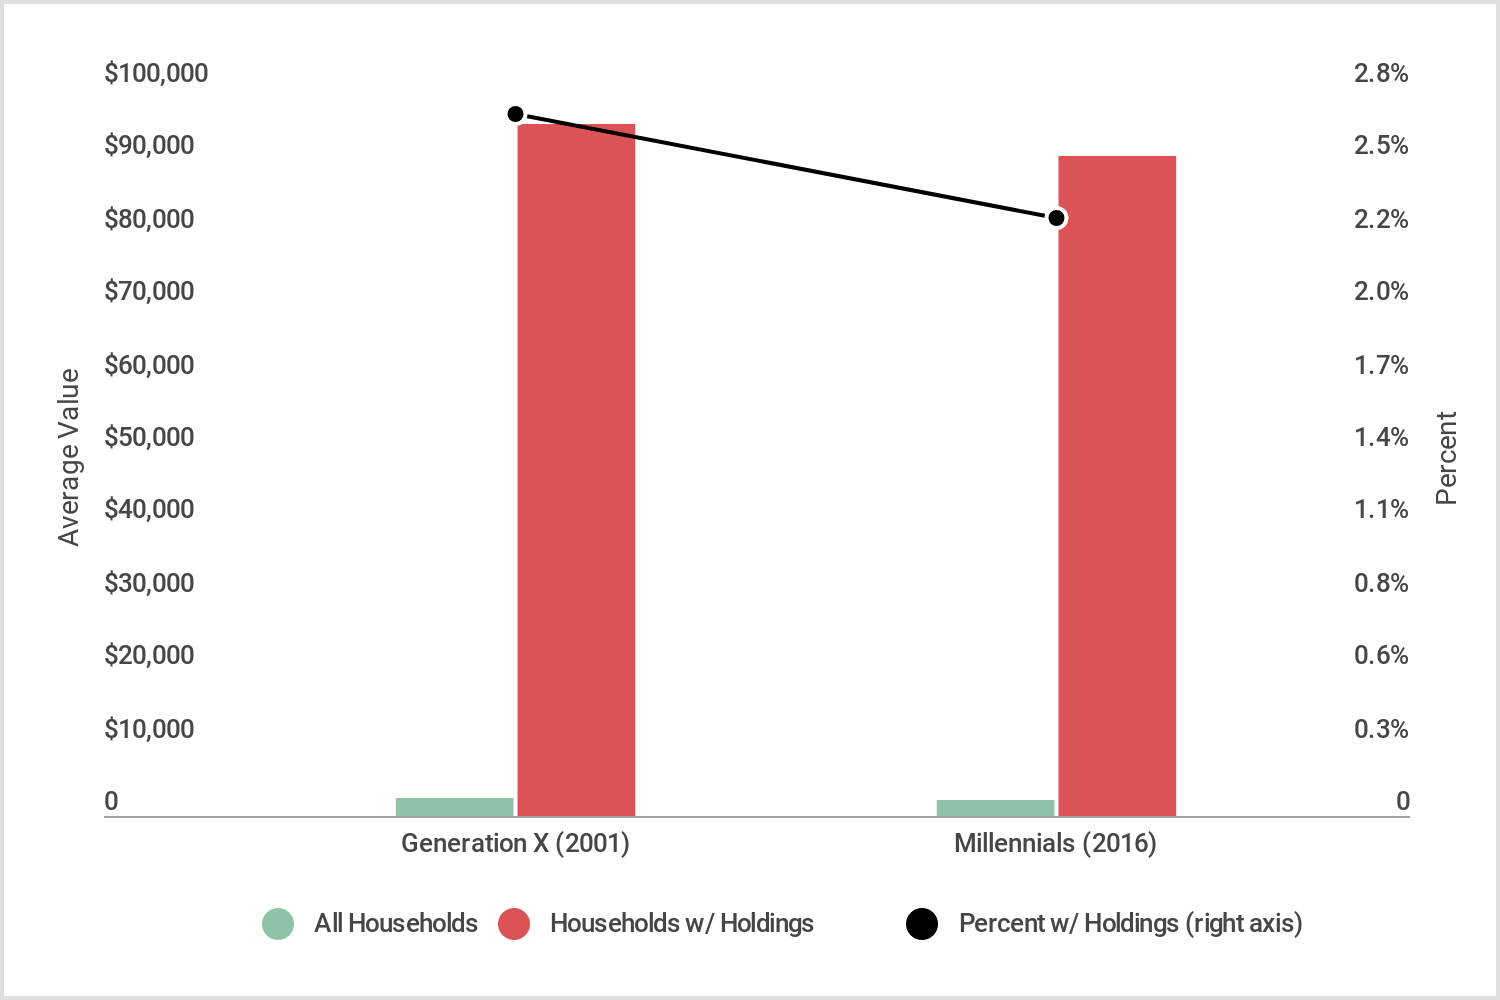 Photo Credit: Credit Sesame