 Photo Credit: Alamy Stock Photo
June of 2019 marked 10 years of uninterrupted economic growth in the U.S., making it the longest expansion on record since 1854, according to the NBER. Unemployment rates are at historic lows and wages are inching up. So it might come as a surprise that more than a fifth of all American homeowners (almost 17 million households) are considered “house poor,” meaning they spend more than 30 percent of their total income on housing-related costs. For renter households, almost 20 million (46 percent of total) are considered house poor.
The ratio of house poor homeowners is far from uniform across the country—the highest proportions of house poor homeowners are found in Northeastern cities, closely followed by cities in the West. California ranks highest in this unfavorable statistic with 32 percent of owned households considered cost-burdened, which is significantly above the national average of 22 percent. Midwestern states, on the other hand, seem to offer a healthy balance between incomes and home prices. For example, only 15 percent of homeowners in North Dakota and South Dakota are considered cost-burdened.
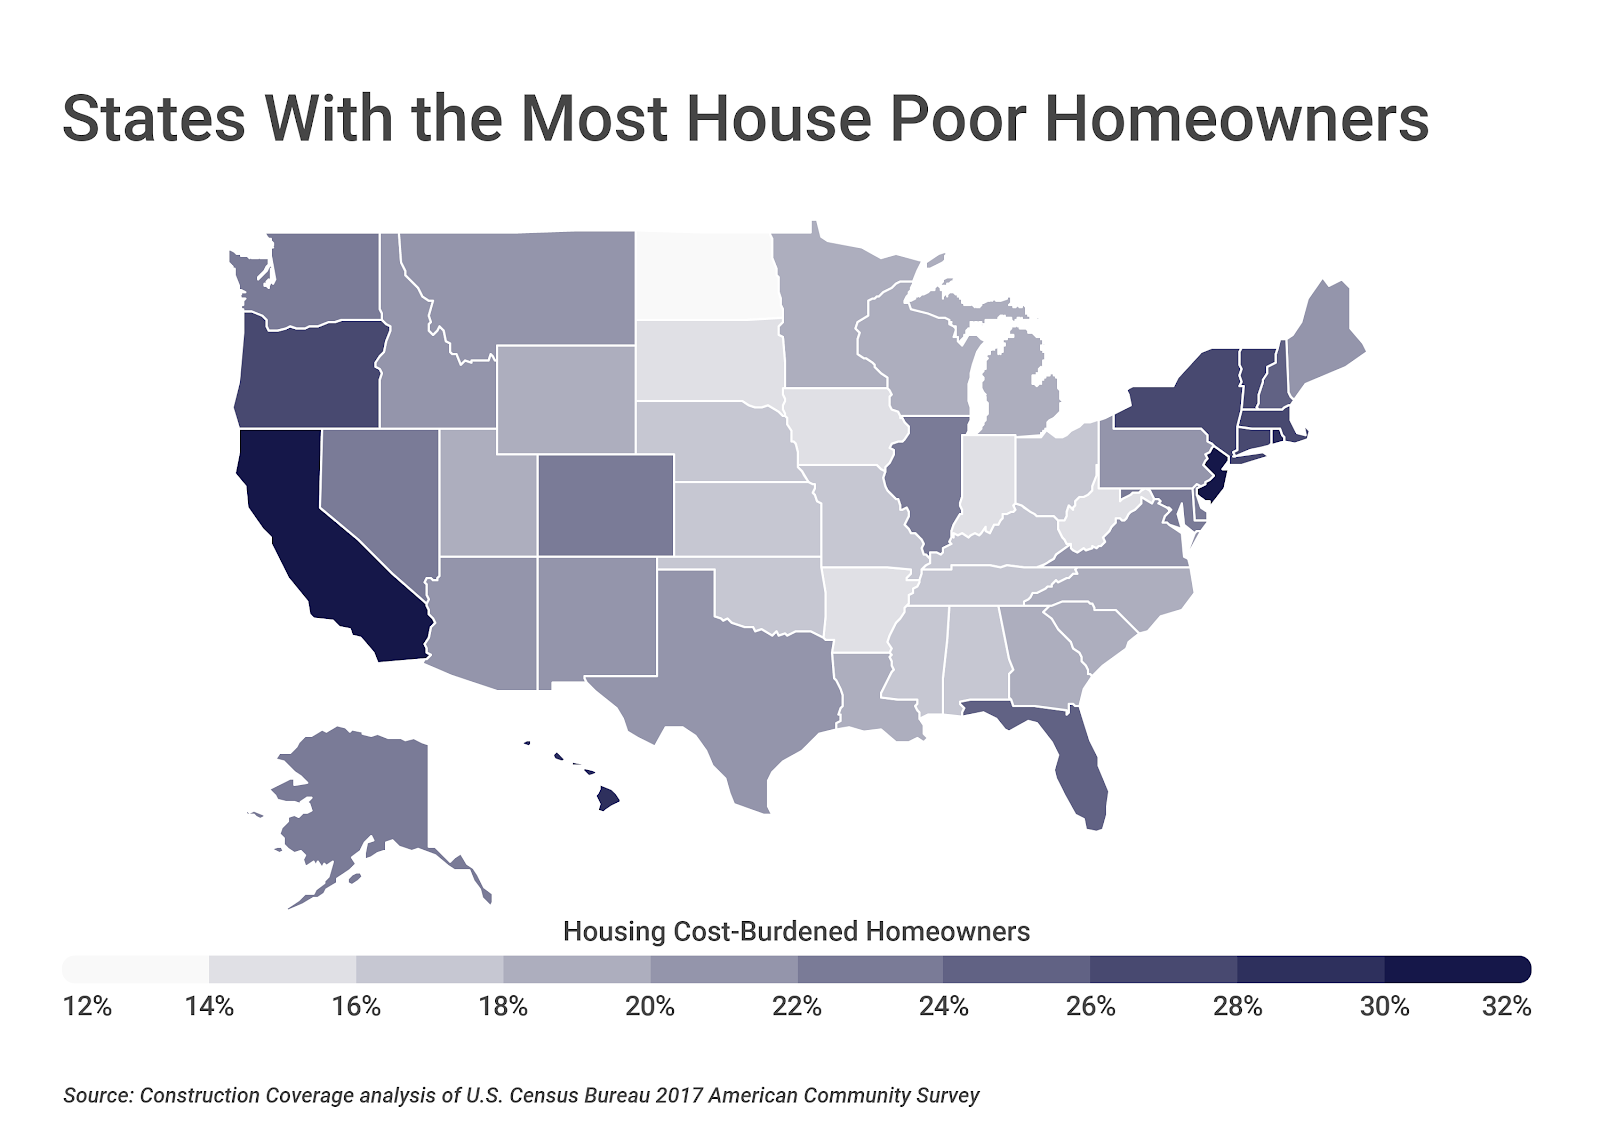
There is a strong negative relationship between the proportion of house poor homeowners and homeownership. In areas with the highest share of residents spending more than 30 percent of income on housing, far fewer people own homes. States in the Northeast exhibit low homeownership and high proportions of cost-burdened homeowners, while many midwestern and southern states demonstrate higher homeownership rates and fewer house poor homeowners.
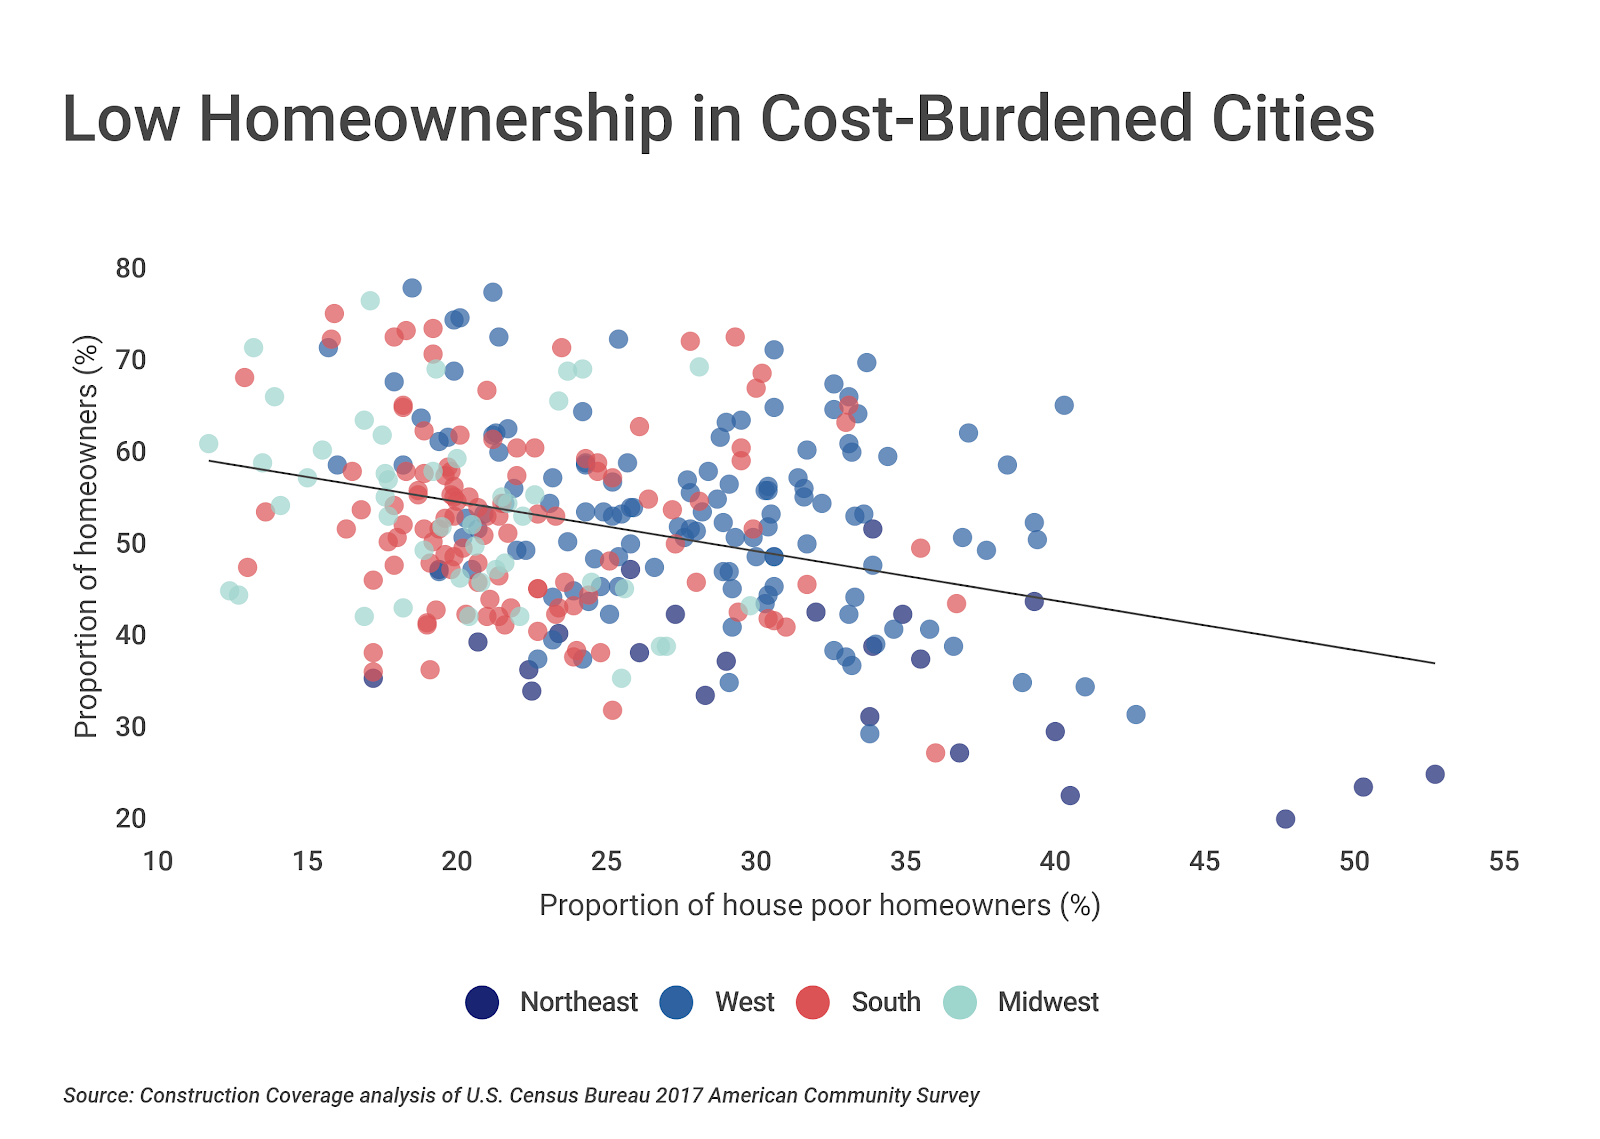
Interestingly, house poverty affects affluent and poor communities alike. Nationally, home values have grown by a whopping 36 percent in the last five years, while incomes increased only by 17 percent. The analysis finds that the strongest predictor of how many residents are housing cost-burdened in a given city is not median household income or median home price, but rather the ratio of between the two.
Midwestern and southern states offer the most affordable real estate (i.e. the lowest median home price to income ratio), while homes in the West are the least affordable in the country—in fact, the seven least affordable cities in the U.S. are all in California. This finding suggests that increased wages will be effective in battling house poverty only if such gains outpace changes in home prices.
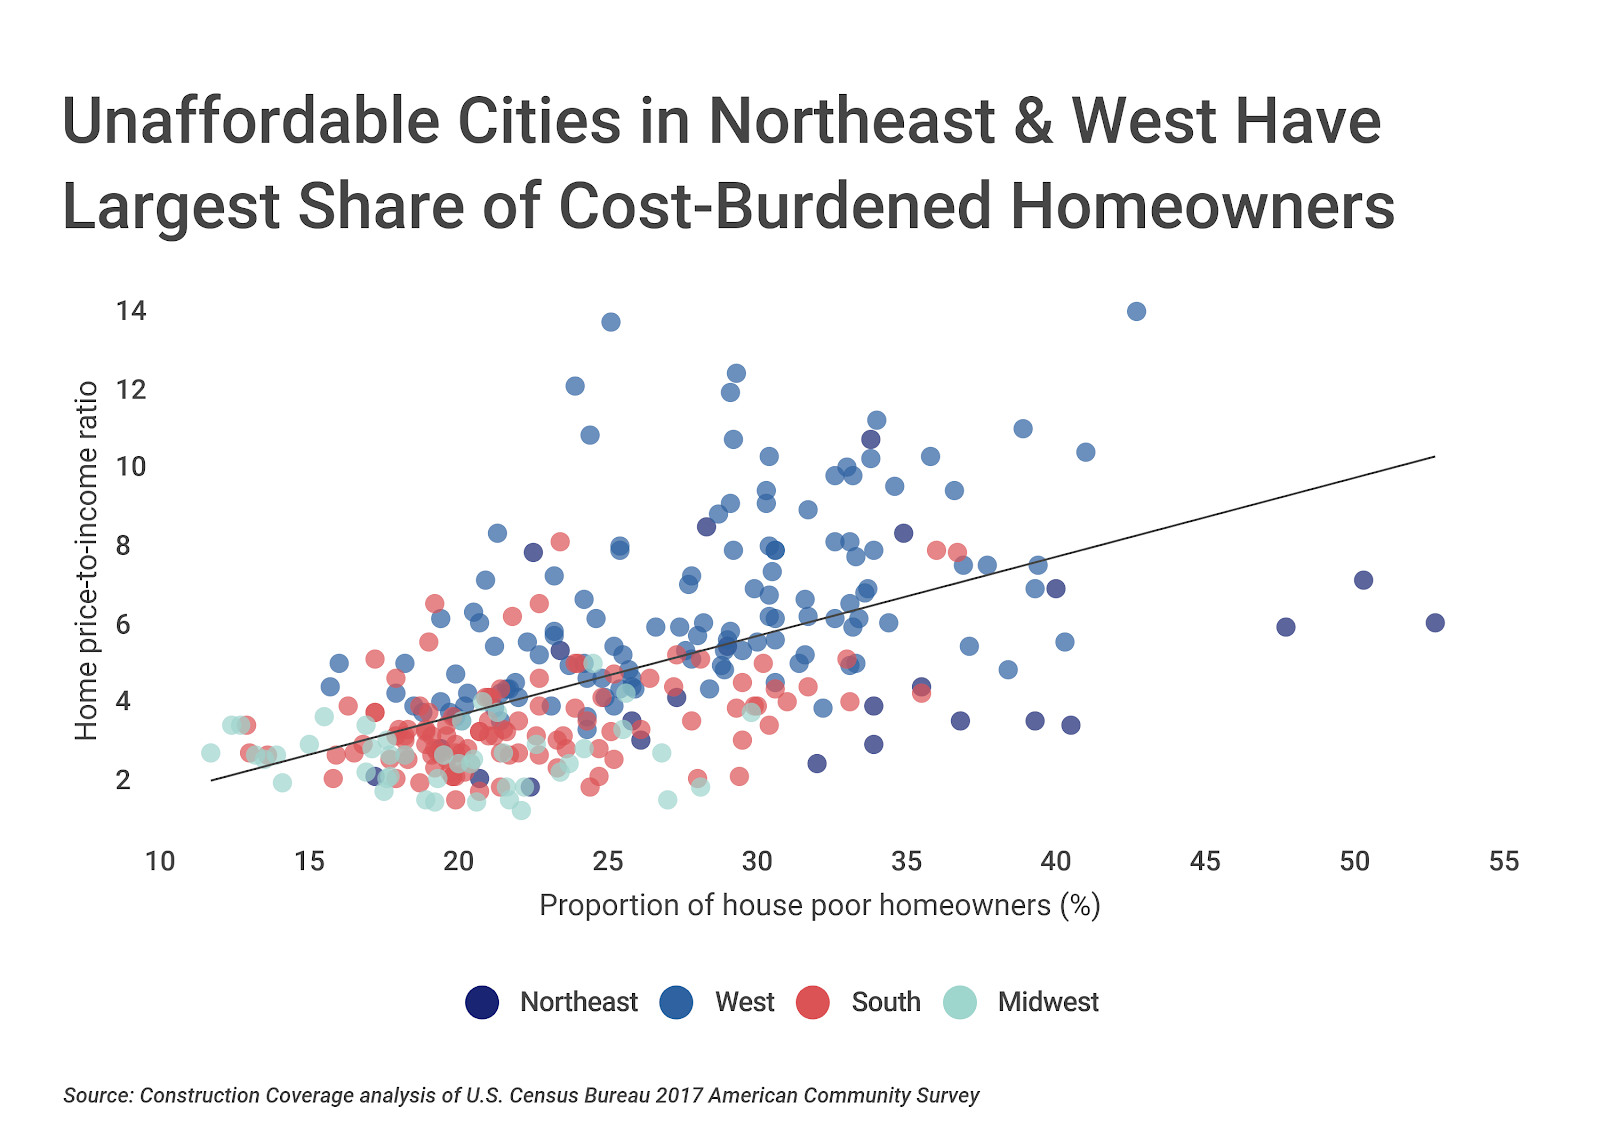
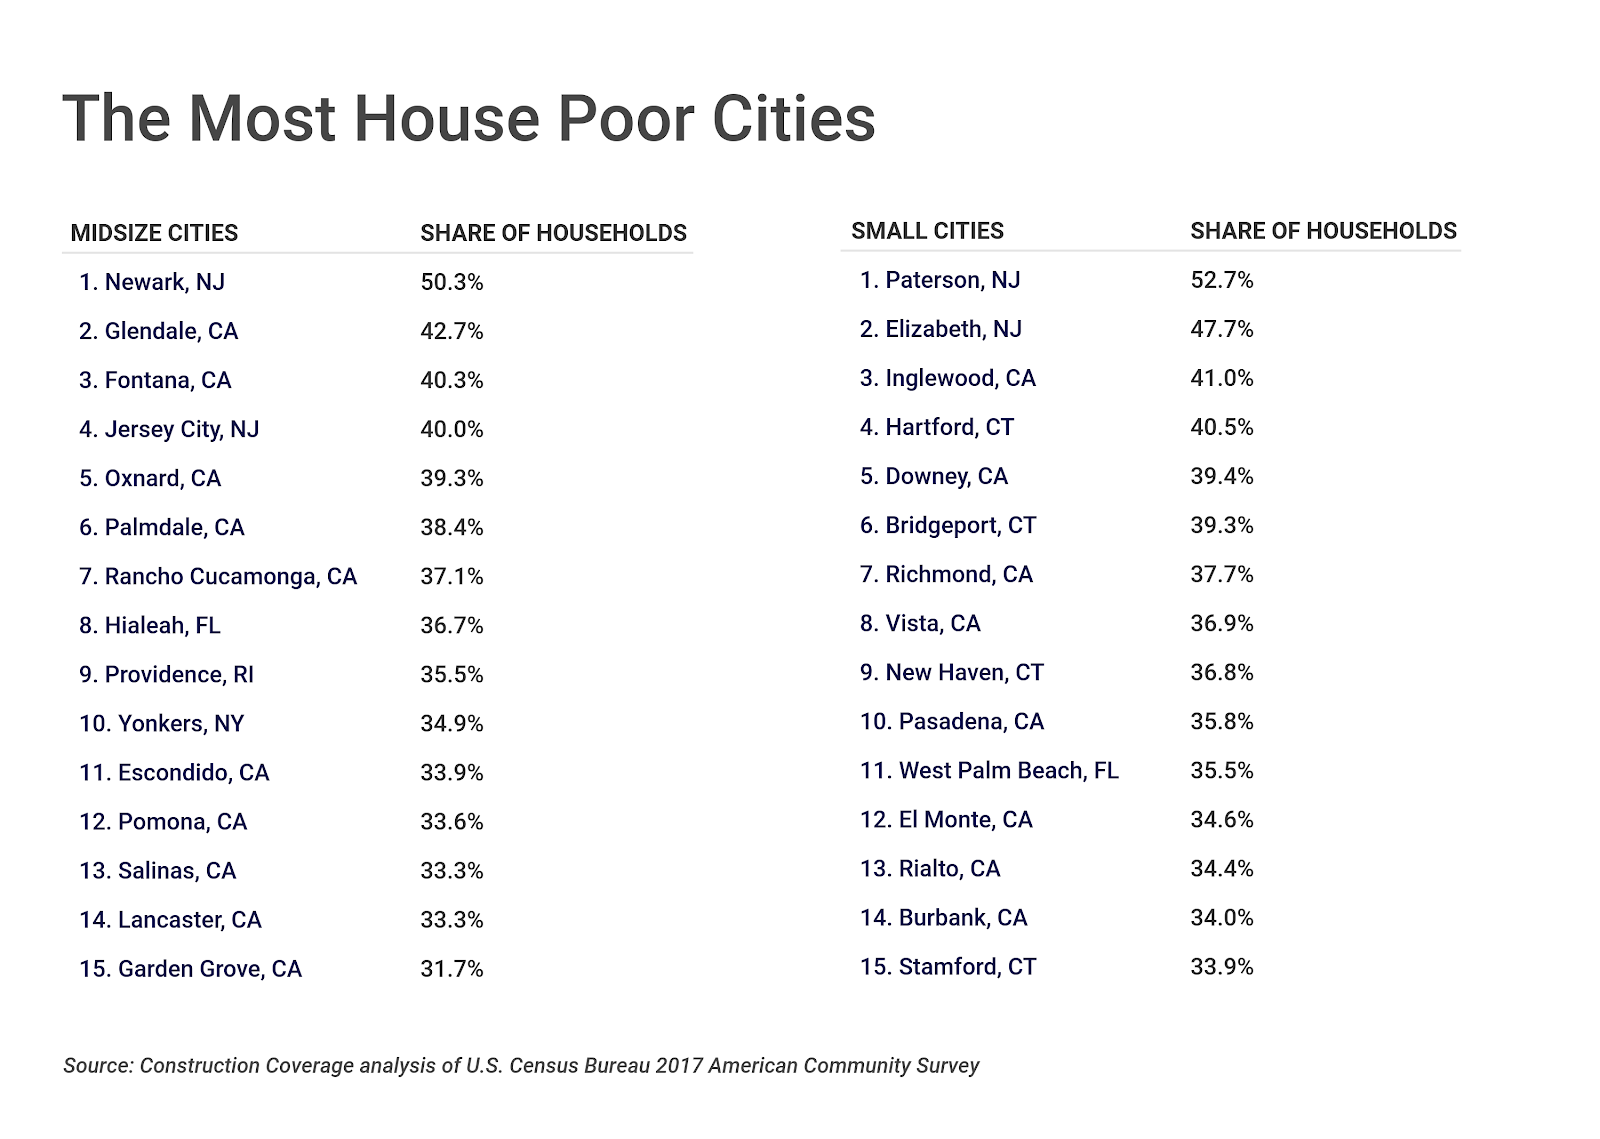
While potential homebuyers may try to avoid large cities in fear of becoming house poor, the relationship between house poverty and population size is negligible. Many large cities, such as Phoenix or San Antonio have relatively few house poor residents. On the other hand, it is not unusual for smaller cities such as Hartford, Connecticut to have a large share of house poor residents.
Researchers at Construction Coverage analyzed the most recent annual data from the U.S. Census Bureau and Zillow to uncover geographic variation in house poverty. All cities in the nation with more than 100,000 residents were considered and ranked by the proportion of homeowners who are housing cost-burdened. Here are the most house poor cities in America: