Skip to main contentSkip to main content
Register for more free articles.
Log in Sign up
Back to homepage
Subscriber Login
Keep reading with a digital access subscription.
Subscribe now
You have permission to edit this collection.
Edit
Arizona Daily Star
76°
  • Sign in
  • Subscribe Now
  • Manage account
  • Logout
    • Manage account
    • e-Newspaper
    • Logout
  • News
    • Sign up for newsletters
    • Local
    • Arizona
    • Business
    • Crime
    • Nation & World
    • Markets & Stocks
    • SaddleBrooke
    • Politics
    • Archives
    • News Tip
  • Arizona Daily Star
    • E-edition
    • E-edition-Tutorial
    • Archives
    • Special Sections
    • Merchandise
    • Circulars
    • Readers' Choice Awards
    • Buyer's Edge
  • Obituaries
    • Share Your Story
    • Recent Obituaries
    • Find an Obituary
  • Opinion
    • Submit a Letter
    • Submit guest opinion
    • Letters to the Editor
    • Opinion & Editorials
    • National Columnists
  • Sports
    • Arizona Wildcats
    • Greg Hansen
    • High Schools
    • Roadrunners
  • Lifestyles
    • Events Calendar
    • Arts & Theatre
    • Food & Cooking
    • Movies & TV
    • Movie Listings
    • Music
    • Comics
    • Games
    • Columns
    • Play
    • Home & Gardening
    • Health
    • Get Healthy
    • Parenting
    • Fashion
    • People
    • Pets
    • Travel
    • Faith
    • Retro Tucson
    • History
    • Travel
    • Outdoors & Rec
    • Community Pages
  • Brand Ave. Studios
  • Join the community
    • News tip
    • Share video
  • Buy & Sell
    • Place an Ad
    • Shop Local
    • Jobs
    • Homes
    • Marketplace
    • I Love A Deal
  • Shopping
  • Customer Service
    • Manage My Account
    • Newsletter Sign-Up
    • Subscribe
    • Contact us
  • Mobile Apps
  • Weather: Live Radar
  • Facebook
  • Twitter
  • Bluesky
  • YouTube
  • Pinterest
  • Instagram
© 2026 Lee Enterprises
Terms of Service | Privacy Policy
Arizona Daily Star
News+
Read Today's E-edition
Arizona Daily Star
News+
  • Log In
  • $1 for 3 months
    Subscribe Now
    • Manage account
    • e-Newspaper
    • Logout
  • E-edition
  • News
  • Obituaries
  • Opinion
  • Wildcats
  • Lifestyles
  • Newsletters
  • Comics & Puzzles
  • Buyer's Edge
  • Jobs
  • 76° Clear
Share This
  • Facebook
  • Twitter
  • Bluesky
  • WhatsApp
  • SMS
  • Email
The 15 best-paying cities for millennials
Share this
  • Facebook
  • Twitter
  • Bluesky
  • WhatsApp
  • SMS
  • Email
  • Print
Spotlight

The 15 best-paying cities for millennials

  • By Allison Kade, MeetFabric.com
  • Nov 29, 2019
  • Nov 29, 2019 Updated Oct 13, 2020

While locations with higher living costs tend to offer higher wages, sometimes wage gains don’t make up for the increased cost.

Intro

Photo Credit: Alamy Stock Photo

As millennials approach their prime earning years, they face unique financial challenges. They are grappling with a combination of mounting student loan debt, increased housing costs and lingering effects of the Great Recession. Despite higher levels of education, millennials are more likely to have lower earnings, fewer assets and less wealth than previous generations at the same age.

Millennials recently surpassed Baby Boomers to become the country’s largest generation, and more of these financially burdened young adults are settling down to start families. In fact, over 17 million millennial women are now mothers, and they currently account for the overwhelming majority of births in the U.S.

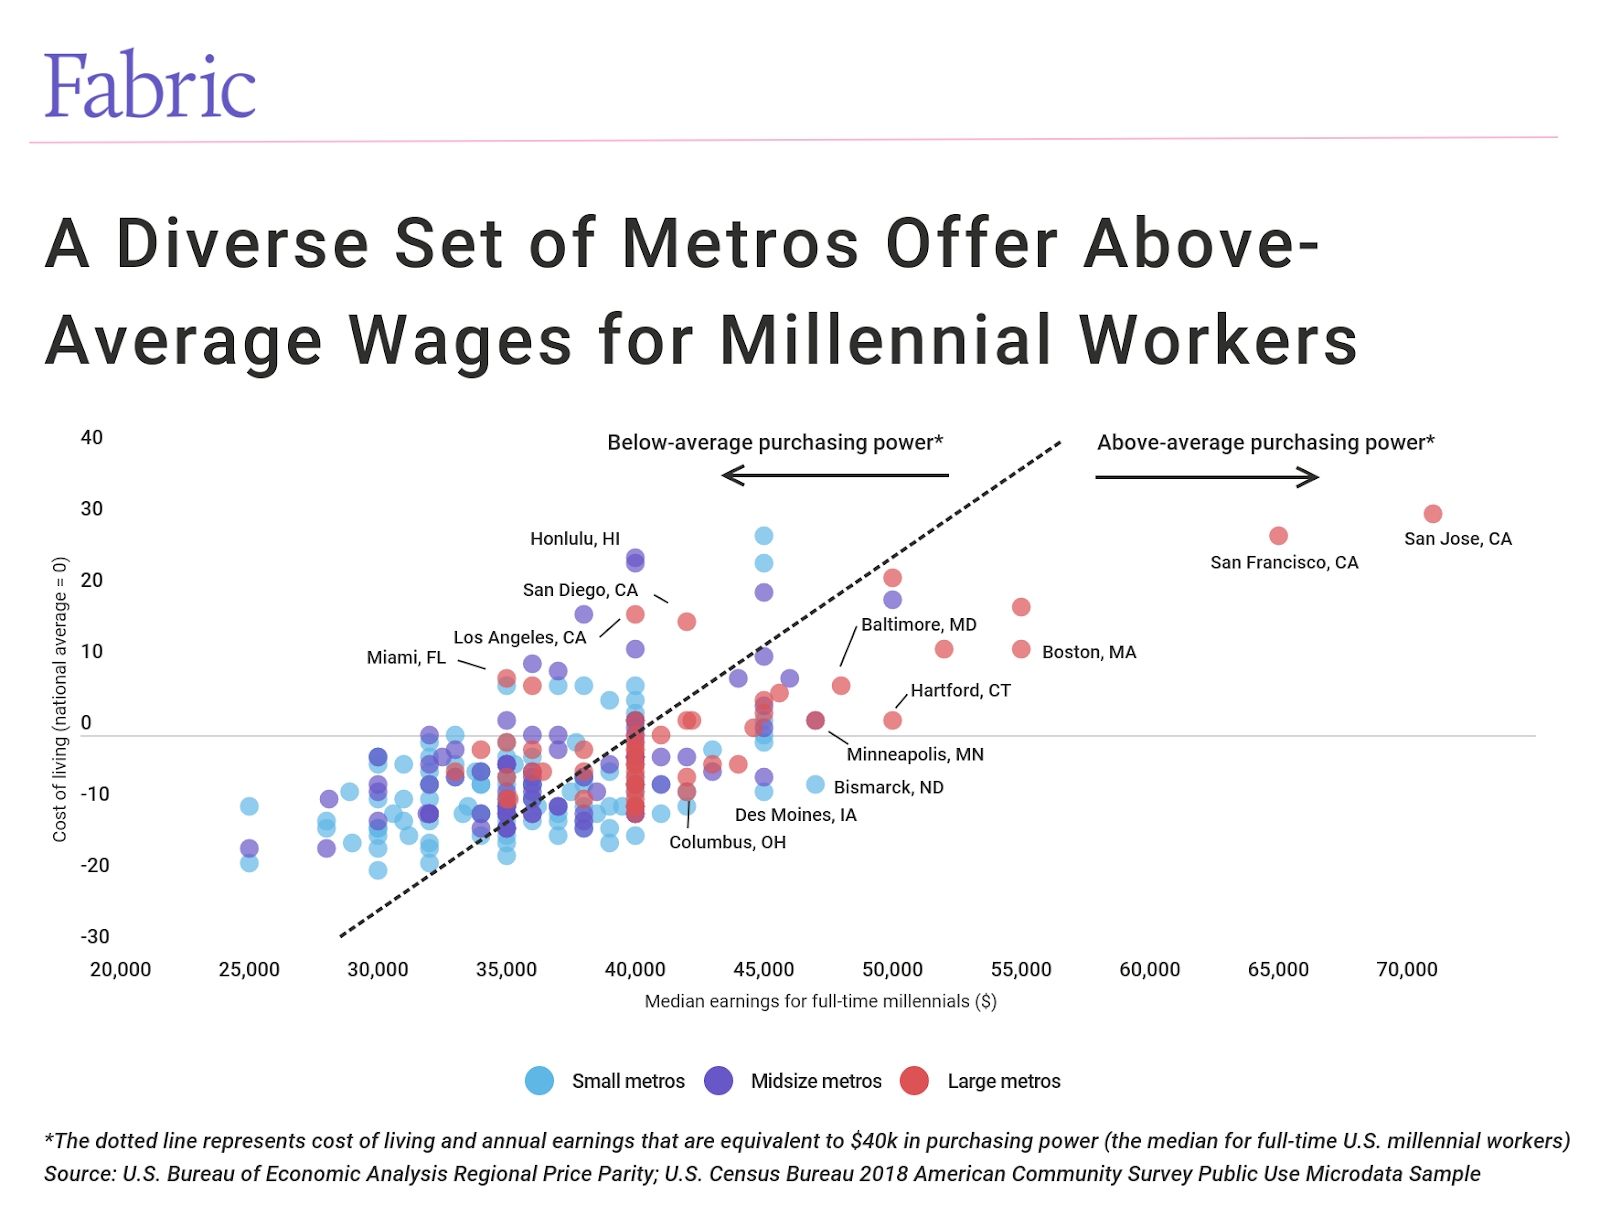
Given the typical full-time millennial worker earns around $40,000 per year, it’s fitting that young millennial families increasingly seek alternatives to big city life, leaving high-priced coastal cities in favor of more affordable cities or suburbs. Of course, while popular, large cities come with steep price tags, they also offer some of the best wages and job opportunities. Fortunately, after taking cost of living into account, a diverse set of metropolitan areas—in terms of both location and size—offer highly competitive salaries for young workers.

To identify the best-paying cities for millennials, researchers at Fabric—a Brooklyn-based startup helping families plan for their financial future—analyzed the latest data from the U.S. Census Bureau. Only metropolitan areas with at least 100,000 people were included.

In order to make wages comparable across locations, dollar amounts for each metro were adjusted up or down based on the relative cost of living. In highly expensive cities such as San Francisco, earnings were adjusted down; in more affordable cities like Birmingham, earnings were adjusted up.

Across the entire U.S., the median annual earnings for full-time millennial workers in 2018 was $40,000. So, in the data below, if adjusted earnings are above $40,000, then millennials in that city tend to experience above-average purchasing power.

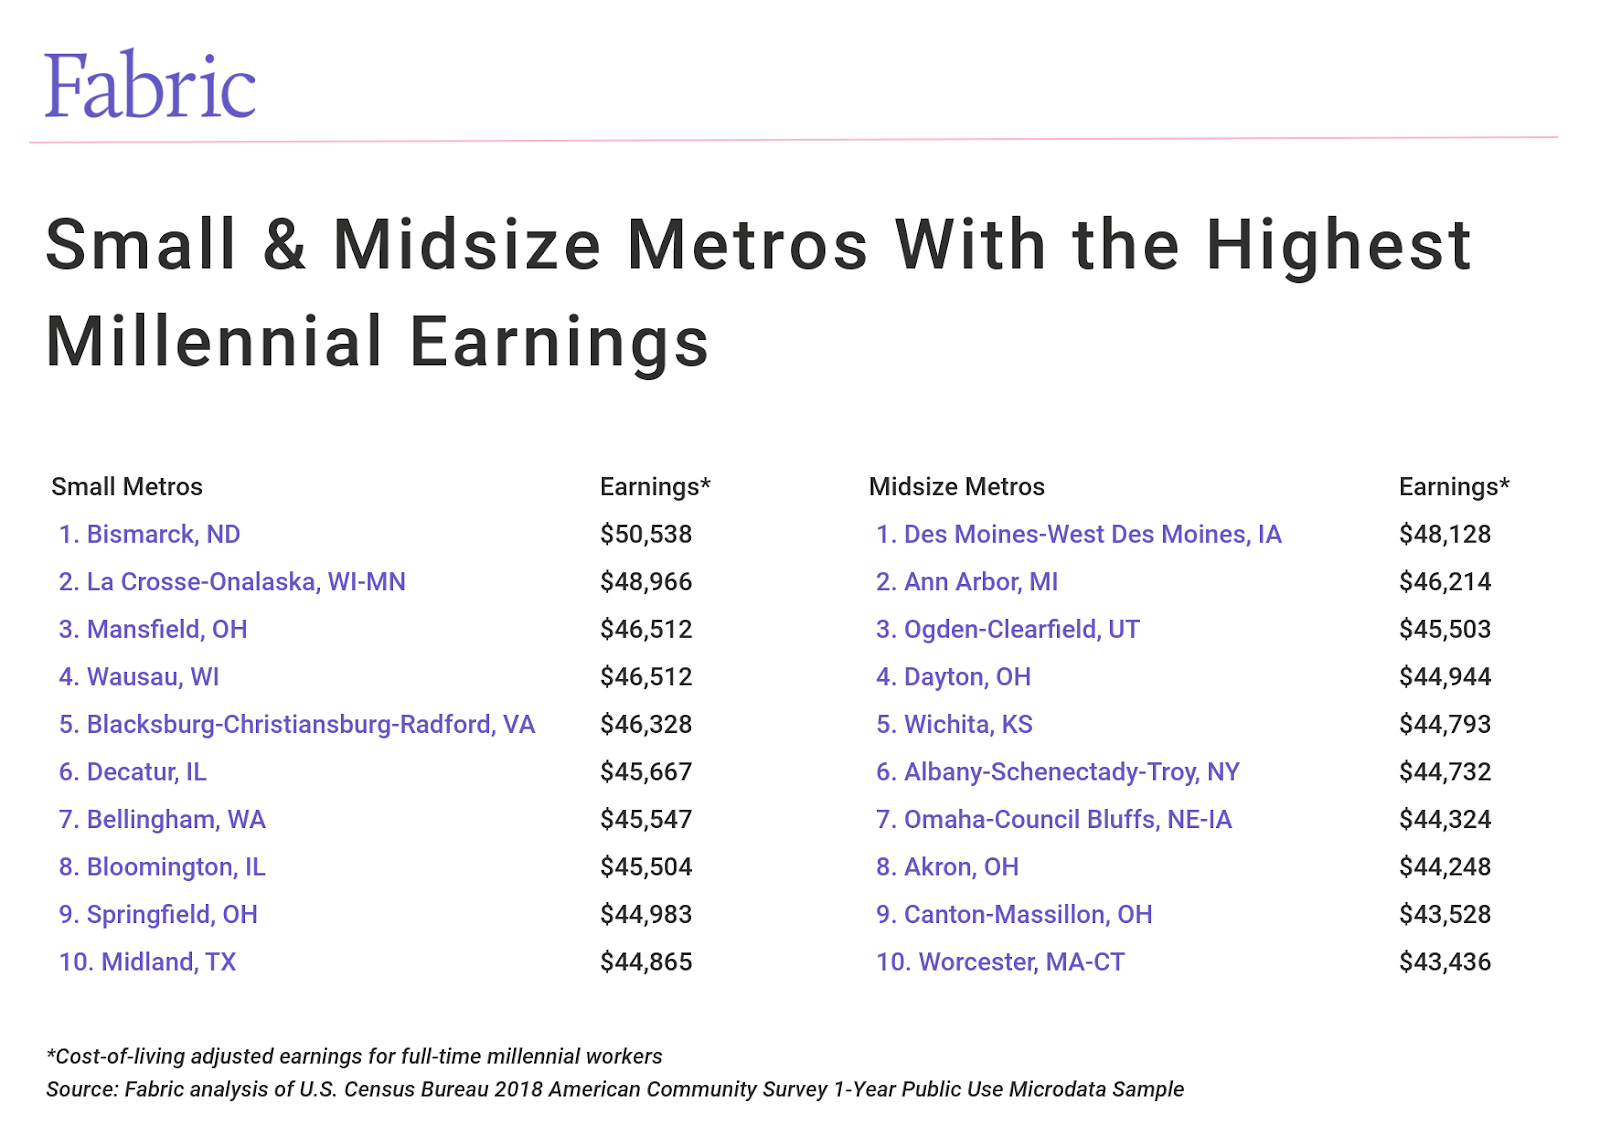
Fabric’s researchers started by identifying the small and midsize metros with the highest cost-of-living adjusted earnings for full-time millennial workers.

Then, they crunched the numbers to identify the 15 best-paying large metropolitan areas. Fabric included wage data for all workers, population growth and median home prices from Zillow. They looked at population growth to see whether more-affordable cities were growing at a faster rate than others, and they looked at home prices as another measure of relative affordability.

Here’s what they found.

15. Austin-Round Rock, TX

Photo Credit: Alamy Stock Photo

  • Median earnings for full-time millennials (adjusted): $44,378
  • Median earnings for full-time millennials (unadjusted): $44,600
  • Median earnings for all full-time workers (unadjusted): $50,000
  • Cost of living: 1% above the national average
  • Median home price: $331,306
  • 5-year population change: 15.1%

14. Cincinnati, OH-KY-IN

Photo Credit: Alamy Stock Photo

  • Median earnings for full-time millennials (adjusted): $44,444
  • Median earnings for full-time millennials (unadjusted): $40,000
  • Median earnings for all full-time workers (unadjusted): $47,100
  • Cost of living: 10% below the national average
  • Median home price: $214,606
  • 5-year population change: 2.4%

13. Pittsburgh, PA

Photo Credit: Alamy Stock Photo

  • Median earnings for full-time millennials (adjusted): $44,681
  • Median earnings for full-time millennials (unadjusted): $42,000
  • Median earnings for all full-time workers (unadjusted): $50,000
  • Cost of living: 6% below the national average
  • Median home price: $173,908
  • 5-year population change: -1.5%

12. Raleigh, NC

Photo Credit: Alamy Stock Photo

  • Median earnings for full-time millennials (adjusted): $44,699
  • Median earnings for full-time millennials (unadjusted): $43,000
  • Median earnings for all full-time workers (unadjusted): $50,000
  • Cost of living: 4% below the national average
  • Median home price: $322,823
  • 5-year population change: 12.3%

11. Baltimore-Columbia-Towson, MD

Photo Credit: Alamy Stock Photo

  • Median earnings for full-time millennials (adjusted): $44,776
  • Median earnings for full-time millennials (unadjusted): $48,000
  • Median earnings for all full-time workers (unadjusted): $57,000
  • Cost of living: 7% above the national average
  • Median home price: $299,146
  • 5-year population change: 1.2%

10. Birmingham-Hoover, AL

Photo Credit: Alamy Stock Photo

  • Median earnings for full-time millennials (adjusted): $45,045
  • Median earnings for full-time millennials (unadjusted): $40,000
  • Median earnings for all full-time workers (unadjusted): $45,000
  • Cost of living: 11% below the national average
  • Median home price: $218,211
  • 5-year population change: 1.2%

9. Columbus, OH

Photo Credit: Alamy Stock Photo

  • Median earnings for full-time millennials (adjusted): $45,504
  • Median earnings for full-time millennials (unadjusted): $42,000
  • Median earnings for all full-time workers (unadjusted): $49,000
  • Cost of living: 8% below the national average
  • Median home price: $238,760
  • 5-year population change: 6.7%

8. Minneapolis-St. Paul-Bloomington, MN-WI

Photo Credit: Alamy Stock Photo

  • Median earnings for full-time millennials (adjusted): $45,988
  • Median earnings for full-time millennials (unadjusted): $47,000
  • Median earnings for all full-time workers (unadjusted): $54,000
  • Cost of living: 2% above the national average
  • Median home price: $323,665
  • 5-year population change: 5.0%

7. Milwaukee-Waukesha-West Allis, WI

Photo Credit: Alamy Stock Photo

  • Median earnings for full-time millennials (adjusted): $46,073
  • Median earnings for full-time millennials (unadjusted): $44,000
  • Median earnings for all full-time workers (unadjusted): $50,000
  • Cost of living: 4% below the national average
  • Median home price: $232,700
  • 5-year population change: 0.3%

6. Washington-Arlington-Alexandria, DC-VA-MD-WV

Photo Credit: Alamy Stock Photo

  • Median earnings for full-time millennials (adjusted): $46,453
  • Median earnings for full-time millennials (unadjusted): $55,000
  • Median earnings for all full-time workers (unadjusted): $65,000
  • Cost of living: 18% above the national average
  • Median home price: $427,708
  • 5-year population change: 5.0%

5. Seattle-Tacoma-Bellevue, WA

Photo Credit: Alamy Stock Photo

  • Median earnings for full-time millennials (adjusted): $46,512
  • Median earnings for full-time millennials (unadjusted): $52,000
  • Median earnings for all full-time workers (unadjusted): $60,000
  • Cost of living: 12% above the national average
  • Median home price: $492,212
  • 5-year population change: 9.1%

4. Hartford-West Hartford-East Hartford, CT

Photo Credit: Alamy Stock Photo

  • Median earnings for full-time millennials (adjusted): $49,116
  • Median earnings for full-time millennials (unadjusted): $50,000
  • Median earnings for all full-time workers (unadjusted): $60,000
  • Cost of living: 2% above the national average
  • Median home price: $251,579
  • 5-year population change: -0.7%

3. Boston-Cambridge-Newton, MA-NH

Photo Credit: Alamy Stock Photo

  • Median earnings for full-time millennials (adjusted): $49,195
  • Median earnings for full-time millennials (unadjusted): $55,000
  • Median earnings for all full-time workers (unadjusted): $63,000
  • Cost of living: 12% above the national average
  • Median home price: $499,533
  • 5-year population change: 3.7%

2. San Francisco-Oakland-Hayward, CA

Photo Credit: Alamy Stock Photo

  • Median earnings for full-time millennials (adjusted): $50,781
  • Median earnings for full-time millennials (unadjusted): $65,000
  • Median earnings for all full-time workers (unadjusted): $72,000
  • Cost of living: 28% above the national average
  • Median home price: $771,421
  • 5-year population change: 4.6%

1. San Jose-Sunnyvale-Santa Clara, CA

Photo Credit: Alamy Stock Photo

  • Median earnings for full-time millennials (adjusted): $54,240
  • Median earnings for full-time millennials (unadjusted): $71,000
  • Median earnings for all full-time workers (unadjusted): $80,000
  • Cost of living: 31% above the national average
  • Median home price: $1,034,366
  • 5-year population change: 3.9%

Detailed findings and methodology

The median annual earnings for full-time working millennials in the U.S. was $40,000 in 2018, about 16 percent lower than the median for all workers of $48,000. Across major metropolitan areas, unadjusted millennial earnings ranged from a low of $25,000 per year to a high of $71,000 per year in San Jose, CA.

Of course, the cost of living varies widely by metro, from a low of 19 percent below average to a high of 31 percent above average. After adjusting for cost of living, the range in earnings narrows from a low of approximately $28,000 per year to a high just over $54,000 annually.

While locations with higher living costs tend to offer higher wages, sometimes wage gains don’t make up for the increased cost, as is the case with San Diego, CA. On the other hand, in metropolitan areas like San Francisco, CA and San Jose, CA higher wages more than make up for increased expenses.

The inverse is also true in low-cost areas. For example, wages can be so depressed that despite lower living costs, residents still experience below-average purchasing power. This is true for Memphis, TN, San Antonio, TX and Tucson, AZ. Fortunately, many low-cost cities offer strong enough wages to boost purchasing power above average, as is the case with many large Midwestern metropolitan areas, such as Minneapolis, MN and Columbus, OH.

While one might expect that cities offering the most purchasing power would attract more residents, the analysis found no significant correlation between adjusted millennial earnings and population growth. Across the best-paying cities for millennials, there’s a wide range in growth rates. For example, Austin, TX grew 15 percent over the past five years, whereas Pittsburgh, PA saw a population decline.

To determine the best-paying cities for millennials, Fabric analyzed data from the U.S. Census Bureau’s 2018 American Community Survey Public Use Microdata Sample (ACS PUMS), the U.S. Census Bureau’s Population Estimates, the Bureau of Economic Analysis’s Regional Price Parity dataset and Zillow. The Pew Research Center defines millennials as the generation of people born in 1981-1996, meaning millennials were 22 to 37 years old in 2018.

Statistics on the median earnings for full-time millennial workers, median earnings for all full-time workers and the share of workers in STEM occupations are from the U.S. Census Bureau’s 2018 American Community Survey Public Use Microdata Sample (ACS PUMS). STEM occupations are defined according to the Census Bureau’s 2018 list of STEM Occupation codes. The cost-of-living index is from the Bureau of Economic Analysis’s Regional Price Parity dataset for 2017, and the 5-year population change is calculated as the percent change in population from 2013 to 2018 using the U.S. Census Bureau’s Population Estimates. Median home list price data is sourced from Zillow.

To make earnings comparable across locations, median earnings for each metro were adjusted using the cost-of-living index for that metro. Earnings in expensive metros were adjusted down to reflect lower purchasing power while earnings in relatively affordable cities were adjusted up to reflect higher purchasing power.

Metro areas are ranked by the cost-of-living adjusted median earnings for full-time millennial workers.

Only metropolitan areas with at least 100,000 people were included in the analysis. Additionally, metro areas were grouped into the following cohorts based on population size:

  • Small metros: 100,000-350,000
  • Midsize metros: 350,000-1,000,000
  • Large metros: more than 1,000,000

Related to this collection

Teenage 'computer genius' could become the first millennial saint

Teenage 'computer genius' could become the first millennial saint

Carlo Acutis, who died of leukemia at the age of 15 in 2006, used his taste for technology to create a website that traced the history of Eucharistic miracles.

Arizona Daily Star
  • Facebook
  • Twitter
  • Bluesky
  • YouTube
  • Instagram
  • Arizona Daily Star Store
  • This is Tucson
  • Saddlebag Notes
  • Tucson Festival of Books

Sites & Partners

  • E-edition
  • Classifieds
  • Events calendar
  • Careers @ Lee Enterprises
  • Careers @ Gannett
  • Online Features
  • Sponsored Blogs
  • Get Healthy

Services

  • Advertise with us
  • Register
  • Contact us
  • RSS feeds
  • Newsletters
  • Photo reprints
  • Subscriber services
  • Subscription FAQ
  • Licensing
  • Shopping
© Copyright 2026 Arizona Daily Star, PO Box 26887 Tucson, AZ 85726-6887
Terms of Use | Privacy Policy | Advertising Terms of Use | Do Not Sell My Info | Cookie Preferences
Powered by BLOX Content Management System from bloxdigital.com.
  • Notifications
  • Settings
You don't have any notifications.

Get up-to-the-minute news sent straight to your device.

Topics

News Alerts

Breaking News