Skip to main contentSkip to main content
Register for more free articles.
Log in Sign up
Back to homepage
Subscriber Login
Keep reading with a digital access subscription.
Subscribe now
You have permission to edit this collection.
Edit
Arizona Daily Star
80°
  • Sign in
  • Subscribe Now
  • Manage account
  • Logout
    • Manage account
    • e-Newspaper
    • Logout
  • News
    • Sign up for newsletters
    • Local
    • Arizona
    • Business
    • Crime
    • Nation & World
    • Markets & Stocks
    • SaddleBrooke
    • Politics
    • Archives
    • News Tip
  • Arizona Daily Star
    • E-edition
    • E-edition-Tutorial
    • Archives
    • Special Sections
    • Merchandise
    • Circulars
    • Readers' Choice Awards
    • Buyer's Edge
  • Obituaries
    • Share Your Story
    • Recent Obituaries
    • Find an Obituary
  • Opinion
    • Submit a Letter
    • Submit guest opinion
    • Letters to the Editor
    • Opinion & Editorials
    • National Columnists
  • Sports
    • Arizona Wildcats
    • Greg Hansen
    • High Schools
    • Roadrunners
  • Lifestyles
    • Events Calendar
    • Arts & Theatre
    • Food & Cooking
    • Movies & TV
    • Movie Listings
    • Music
    • Comics
    • Games
    • Columns
    • Play
    • Home & Gardening
    • Health
    • Get Healthy
    • Parenting
    • Fashion
    • People
    • Pets
    • Travel
    • Faith
    • Retro Tucson
    • History
    • Travel
    • Outdoors & Rec
    • Community Pages
  • Brand Ave. Studios
  • Join the community
    • News tip
    • Share video
  • Buy & Sell
    • Place an Ad
    • Shop Local
    • Jobs
    • Homes
    • Marketplace
    • I Love A Deal
  • Shopping
  • Customer Service
    • Manage My Account
    • Newsletter Sign-Up
    • Subscribe
    • Contact us
  • Mobile Apps
  • Weather: Live Radar
  • Facebook
  • Twitter
  • Bluesky
  • YouTube
  • Pinterest
  • Instagram
© 2026 Lee Enterprises
Terms of Service | Privacy Policy
Arizona Daily Star
News+
Read Today's E-edition
Arizona Daily Star
News+
  • Log In
  • $1 for 3 months
    Subscribe Now
    • Manage account
    • e-Newspaper
    • Logout
  • E-edition
  • News
  • Obituaries
  • Opinion
  • Wildcats
  • Lifestyles
  • Newsletters
  • Comics & Puzzles
  • Buyer's Edge
  • Jobs
  • 80° Sunny
Share This
  • Facebook
  • Twitter
  • Bluesky
  • WhatsApp
  • SMS
  • Email
The 15 states with the most teens driving under the influence
Share this
  • Facebook
  • Twitter
  • Bluesky
  • WhatsApp
  • SMS
  • Email
  • Print
Spotlight

The 15 states with the most teens driving under the influence

  • CheapCarInsuranceQuotes.com
  • Oct 4, 2019
  • Oct 4, 2019 Updated Apr 9, 2021

States with larger shares of high school students who drink and drive tend to have more drunk driving deaths per capita.

Intro

Photo Credit: Alamy Stock Photo

Since the passage of the National Minimum Legal Drinking Act in 1984, the legal age at which someone can purchase and consume alcohol in the U.S. is 21. Despite the higher legal drinking age and stringent punishments for offenders, underage drinking and its associated consequences are still a major problem.

In 2017, 29.8 percent of teens engaged in underage drinking. According to the 2015 National Survey on Drug Use and Health (NSDUH), about 623,000 teenagers ages 12-17 also suffer from an alcohol use disorder (abuse or dependence), accounting for 2.5 percent of individuals in this age group.

Research indicates that drinking underage can lead to a range of negative consequences, including issues with adolescent brain development, increased risk of sexual assault, and increased risk of traffic fatalities. While 3.1 percent of adults report driving after having too much to drink, 5.5 percent of teens nationwide have reported driving after drinking any alcohol, according to data from the Centers for Disease Control and Prevention (CDC).

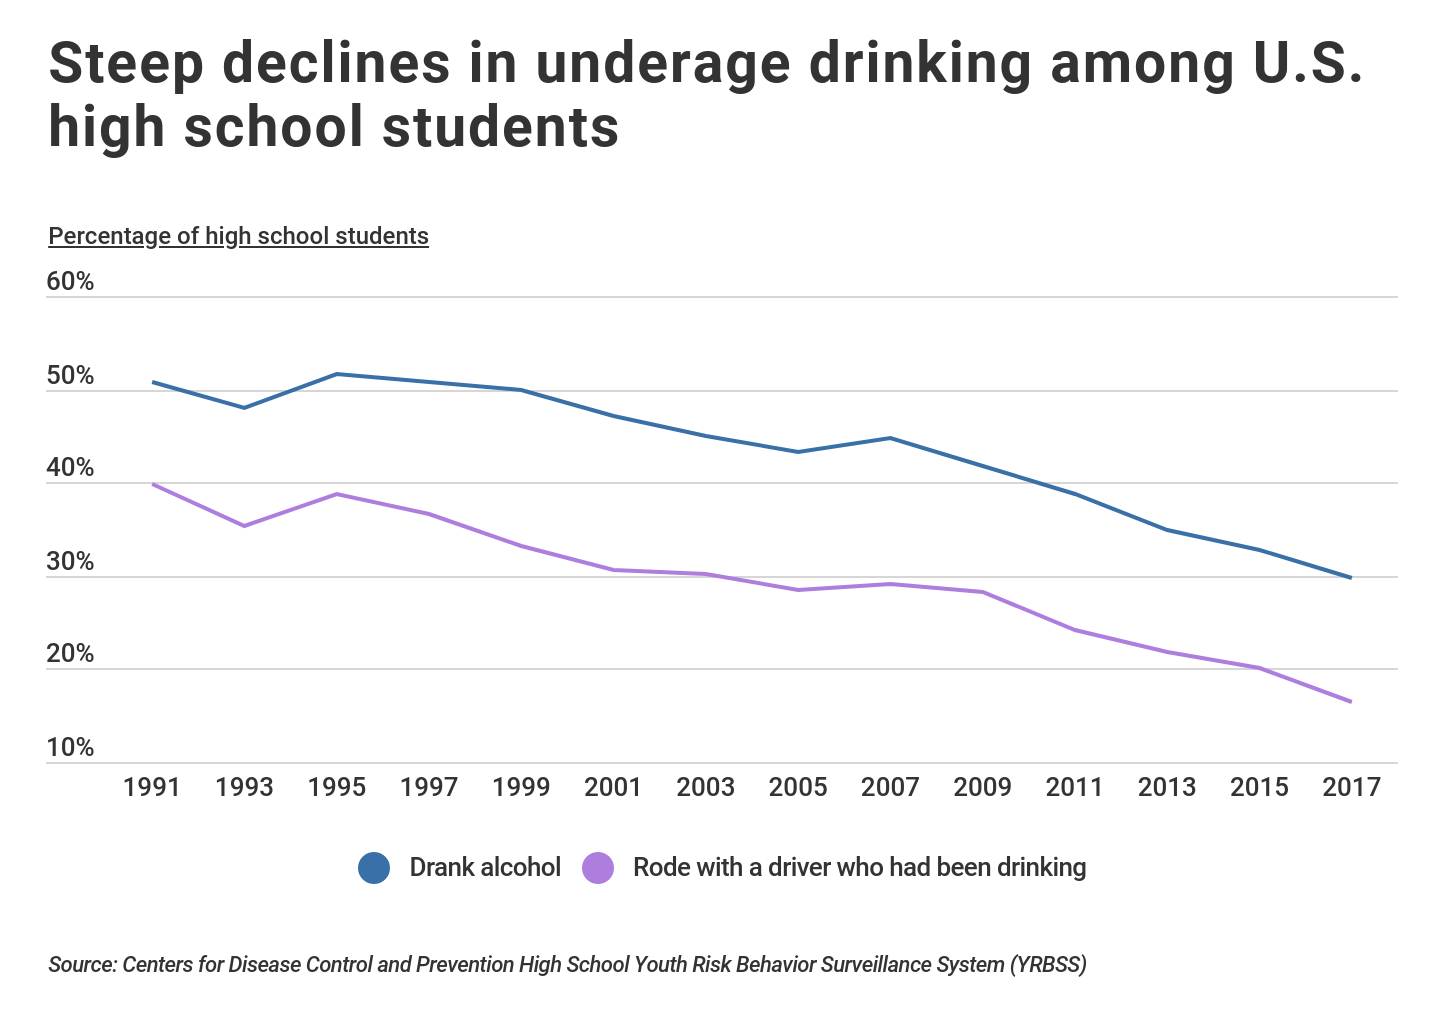
The good news is that statistics on teen alcohol use and drunk driving are improving. The percentage of teens who reported using alcohol declined from more than 50 percent in 1991 to less than 30 percent in 2017. Similarly, 16.5 percent of U.S. teens in 2017 reported riding in a car with a driver who had been drinking alcohol—a decline of more than 23 percentage points during the same time period.

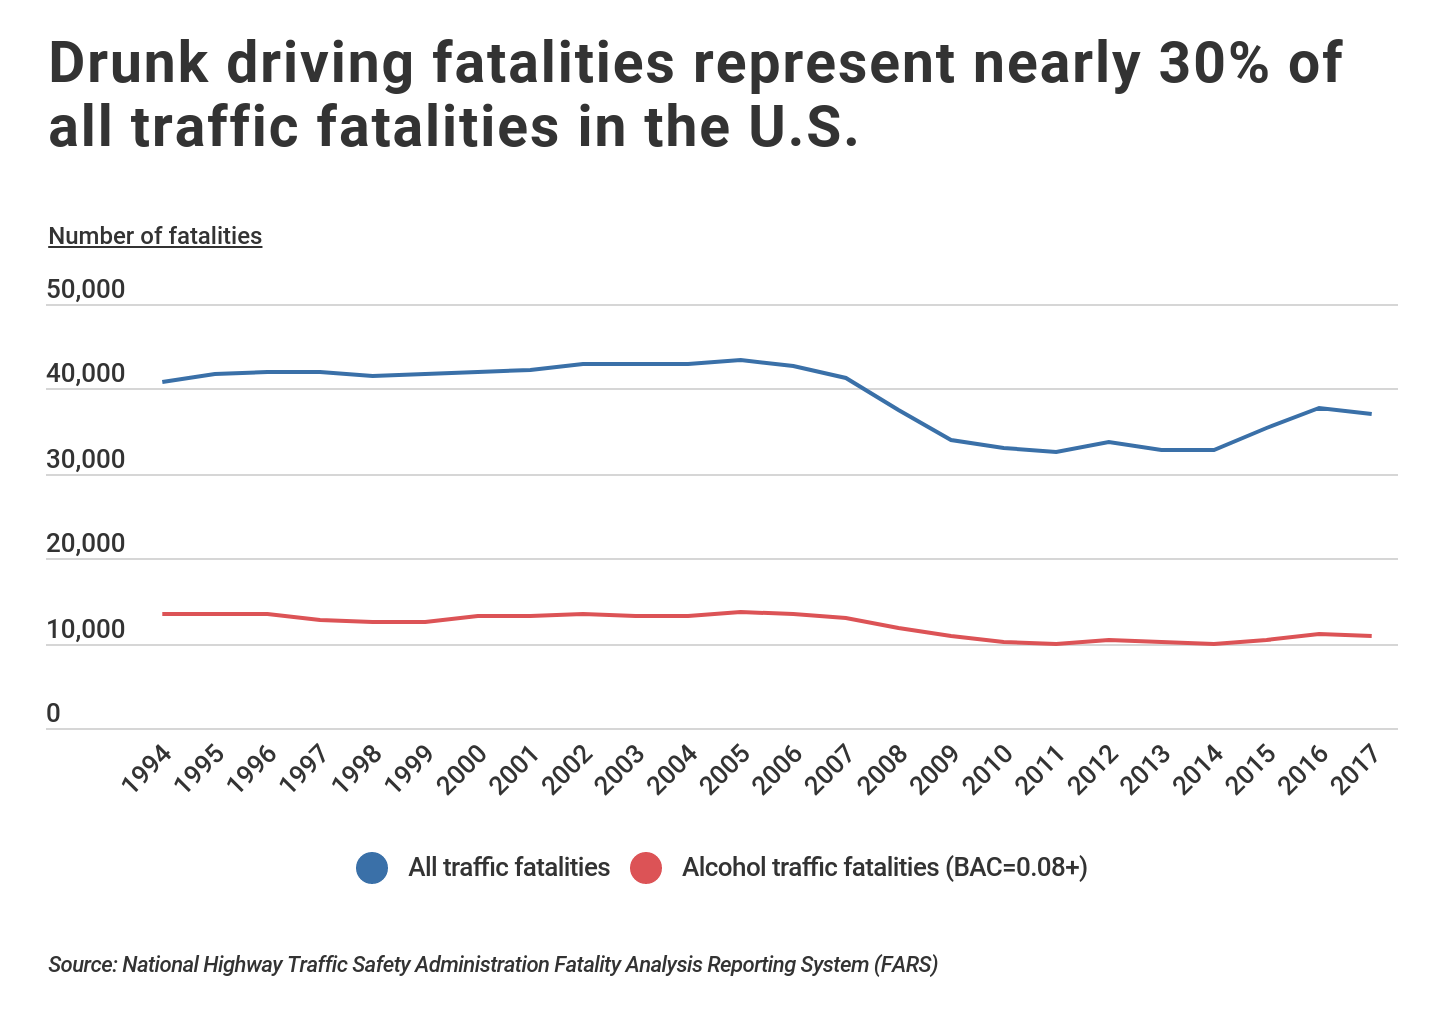
Driving under the influence endangers not only the driver’s life, but also the lives of passengers, pedestrians, and other drivers on the road. Drunk driving traffic fatalities represent almost a third of all driving fatalities. Among the 37,133 motor vehicle fatalities in 2017, 10,874 involved a driver with a blood alcohol concentration of 0.08 or higher.

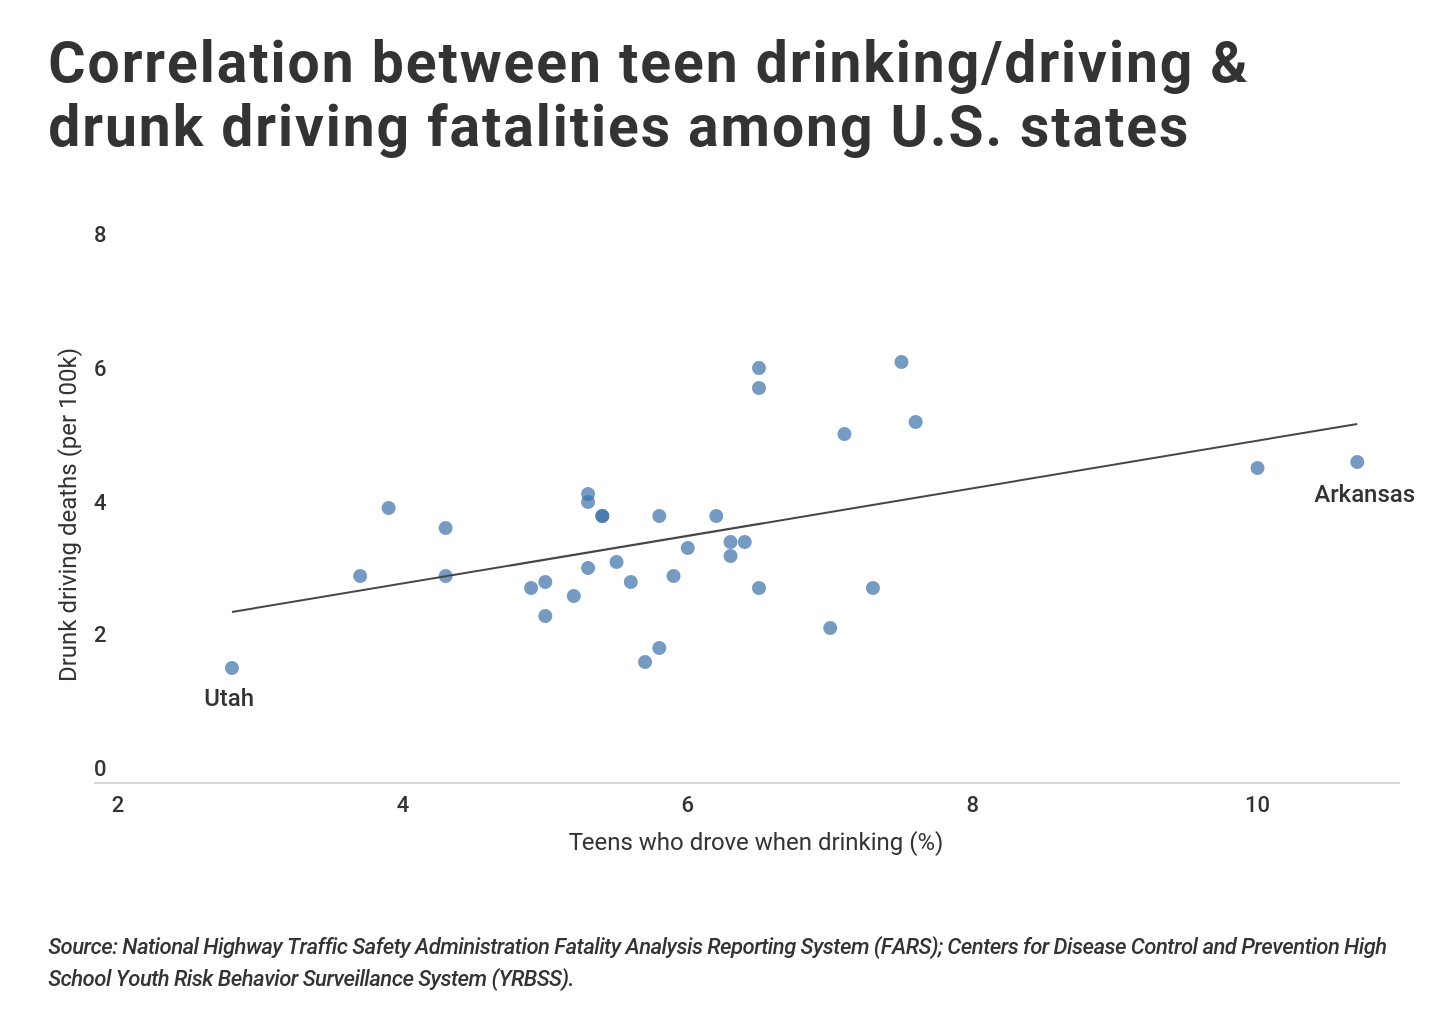
At the state level, there isn’t a statistically significant correlation between drunk driving fatality rates and the proportion of adults who report driving after having too much to drink. However, there is a significant correlation between state-level drunk driving fatality rates and the proportion of high school students who report drinking and driving. States with larger shares of high school students who drink and drive tend to have more drunk driving deaths per capita.

For example, only 2.8 percent of high schoolers in Utah report driving after drinking alcohol, and there are only 1.7 drunk driving traffic deaths per 100,000 people in the state. By contrast, in Arkansas, 10.7 percent of students report driving after drinking, and the state’s drunk driving fatality rate is 4.8. Nationwide, the number of drunk driving deaths per 100,000 people is 3.4.

In addition to the health and safety concerns associated with underage drinking, there are staggering financial costs as well. The CDC estimates that underage drinking costs the U.S. around $24 billion a year. Similarly, motor vehicle crashes involving alcohol amount to more than $44 billion per year. The financial costs of alcohol-related collisions encompass healthcare, property damage, and lost workplace productivity.

To find where teens are most likely to drive under the influence, researchers at CheapCarInsuranceQuotes.com analyzed data from the Centers for Disease Control and Prevention High School Youth Risk Behavior Surveillance System (YRBSS). They ranked states by the percentage of teens who reported driving after drinking one or more times in the past 30 days. Here’s what they found.

15. Idaho

Photo Credit: Alamy Stock Photo

  • Teens who drove when they had been drinking: 6.0%
  • Teens who rode with a driver who had been drinking: 15.9%
  • Teens who drank alcohol: 26.5%
  • Adults who drove after having too much to drink: 2.9%
  • Drunk driving traffic deaths: 3.5 per 100k people

14. Arizona

Photo Credit: Alamy Stock Photo

  • Teens who drove when they had been drinking: 6.2%
  • Teens who rode with a driver who had been drinking: 19.2%
  • Teens who drank alcohol: 33.1%
  • Adults who drove after having too much to drink: 2.1%
  • Drunk driving traffic deaths: 4.0 per 100k people

13. Connecticut

Photo Credit: Alamy Stock Photo

  • Teens who drove when they had been drinking: 6.3%
  • Teens who rode with a driver who had been drinking: 17.2%
  • Teens who drank alcohol: 30.4%
  • Adults who drove after having too much to drink: 3.2%
  • Drunk driving traffic deaths: 3.4 per 100k people

12. Nebraska

Photo Credit: Alamy Stock Photo

  • Teens who drove when they had been drinking: 6.3%
  • Teens who rode with a driver who had been drinking: 22.1%
  • Teens who drank alcohol: 24.4%
  • Adults who drove after having too much to drink: 5.1%
  • Drunk driving traffic deaths: 3.6 per 100k people

11. Kansas

Photo Credit: Alamy Stock Photo

  • Teens who drove when they had been drinking: 6.4%
  • Teens who rode with a driver who had been drinking: 18.6%
  • Teens who drank alcohol: 29.9%
  • Adults who drove after having too much to drink: 2.9%
  • Drunk driving traffic deaths: 3.6 per 100k people

10. Iowa

Photo Credit: Alamy Stock Photo

  • Teens who drove when they had been drinking: 6.5%
  • Teens who rode with a driver who had been drinking: 20.8%
  • Teens who drank alcohol: 27.6%
  • Adults who drove after having too much to drink: 5.2%
  • Drunk driving traffic deaths: 2.9 per 100k people

9. New Mexico

Photo Credit: Alamy Stock Photo

  • Teens who drove when they had been drinking: 6.5%
  • Teens who rode with a driver who had been drinking: 20.4%
  • Teens who drank alcohol: 26.2%
  • Adults who drove after having too much to drink: 2.0%
  • Drunk driving traffic deaths: 5.9 per 100k people

8. North Dakota

Photo Credit: Alamy Stock Photo

  • Teens who drove when they had been drinking: 6.5%
  • Teens who rode with a driver who had been drinking: 16.5%
  • Teens who drank alcohol: 29.1%
  • Adults who drove after having too much to drink: 4.7%
  • Drunk driving traffic deaths: 6.2 per 100k people

7. District of Columbia

Photo Credit: Alamy Stock Photo

  • Teens who drove when they had been drinking: 7.0%
  • Teens who rode with a driver who had been drinking: 22.1%
  • Teens who drank alcohol: 20.5%
  • Adults who drove after having too much to drink: 3.3%
  • Drunk driving traffic deaths: 2.3 per 100k people

6. Texas

Photo Credit: Alamy Stock Photo

  • Teens who drove when they had been drinking: 7.1%
  • Teens who rode with a driver who had been drinking: 20.8%
  • Teens who drank alcohol: 26.8%
  • Adults who drove after having too much to drink: 4.3%
  • Drunk driving traffic deaths: 5.2 per 100k people

5. Vermont

Photo Credit: Alamy Stock Photo

  • Teens who drove when they had been drinking: 7.3%
  • Teens who rode with a driver who had been drinking: 17.9%
  • Teens who drank alcohol: 33.0%
  • Adults who drove after having too much to drink: 2.9%
  • Drunk driving traffic deaths: 2.9 per 100k people

4. South Carolina

Photo Credit: Alamy Stock Photo

  • Teens who drove when they had been drinking: 7.5%
  • Teens who rode with a driver who had been drinking: 18.1%
  • Teens who drank alcohol: 25.4%
  • Adults who drove after having too much to drink: 3.1%
  • Drunk driving traffic deaths: 6.3 per 100k people

3. Montana

Photo Credit: Alamy Stock Photo

  • Teens who drove when they had been drinking: 7.6%
  • Teens who rode with a driver who had been drinking: 19.8%
  • Teens who drank alcohol: 33.1%
  • Adults who drove after having too much to drink: 3.7%
  • Drunk driving traffic deaths: 5.4 per 100k people

2. Louisiana

Photo Credit: Alamy Stock Photo

  • Teens who drove when they had been drinking: 10.0%
  • Teens who rode with a driver who had been drinking: 28.2%
  • Teens who drank alcohol: 34.0%
  • Adults who drove after having too much to drink: 4.6%
  • Drunk driving traffic deaths: 4.7 per 100k people

1. Arkansas

Photo Credit: Alamy Stock Photo

  • Teens who drove when they had been drinking: 10.7%
  • Teens who rode with a driver who had been drinking: 26.3%
  • Teens who drank alcohol: 25.7%
  • Adults who drove after having too much to drink: 3.1%
  • Drunk driving traffic deaths: 4.8 per 100k people

Methodology and full results

Data on teen drinking patterns is from the Centers for Disease Control and Prevention High School Youth Risk Behavior Surveillance System (YRBSS). Details for the reported metrics are described below:

  • Teens who drove when they had been drinking: in a car or other vehicle, one or more times during the 30 days before the survey, among students who had driven.
  • Teens who rode with a driver who had been drinking: in a car or other vehicle, one or more times during the 30 days before the survey.
  • Teens who drank alcohol: at least one drink of alcohol, on at least 1 day during the 30 days before the survey.

Adult drinking and driving statistics are from the Centers for Disease Control and Prevention Behavioral Risk Factor Surveillance System (BRFSS), and alcohol-related traffic death statistics are from the National Highway Traffic Safety Administration Fatality Analysis Reporting System (FARS). For the purpose of this report, drunk driving fatalities are those in which the highest driver blood alcohol concentration involved in the crash was above the legal limit of 0.08.

All data is for 2017, the most recent available year. States are ordered by the percentage of teens who report driving when they had been drinking. The CDC does not provide this data for the following states: Alabama, Delaware, Georgia, Hawaii, Indiana, Kentucky, Maine, Mississippi, New Jersey, New York, Ohio, South Dakota, and Wyoming.

The most dangerous states for drinking and driving

Intro

Drunken driving
Graphicstock

Over the last decades, the United States has greatly reduced the frequency of drunk driving and and the all-too-predictable accidents that result. Thanks to advocacy efforts, educational campaigns, and evolving social perceptions of the once-common practice of getting behind the wheel after too many alcoholic drinks, the number of fatalities resulting from alcohol-impaired driving dropped by 27% between 2005 and 2014, according to the the National Highway Transportation Safety Administration.

However the news isn’t all good. According to The Centers for Disease Control and Prevention (CDC), 28 people are killed in drunk driving accidents every day, with 10,265 individuals losing their lives in 2015 alone.

While drunk driving accidents are a nationwide problem, there are state-to-state differences in how likely you are to encounter an intoxicated driver in your headlights. To determine which states’ drivers are most likely to pose a threat, the insurance comparison site Insurify analyzed over a million automobile insurance shopper applications to determine which drivers are most likely to pose a threat behind the wheel.

—Insurify

Methodology

Insurify provides car insurance quotes based on customers’ answers to questions about driving history, vehicle type, and other personal data. The rankings in this article are based on a set of 1.3 million automobile insurance shopper applications. Each shopper was asked whether any drivers on their policy application had been ticketed or arrested for drunk driving, allowing Insurify to calculate the percentage of shoppers in each state with a history of intoxicated driving. The data correlates well to a CDC study of driving behavior by state. Additional data from the CDC on state-level DUI fatalities from 2003 - 2012 is added to the analysis.

The following states have the highest prevalence of drunk driving in the nation.

10. Hawaii

Photo Credit: Wikimedia

Drivers Reporting History of DUI: 3.2%

Fatalities in Accidents Involving an Intoxicated Driver: 484

First Offense License Loss: One year

While Hawaii usually evokes images of sandy beaches and palm trees, there is a darker side to the island. Ranking 10th on the list of drivers with a DUI history, Hawaii’s reputation as an island paradise is tempered by the relative frequency of drunk driving. With 3.2% of auto insurance shoppers reporting a DUI, and 2.1% of survey respondents admitting to intoxicated driving in the last 30 days, America’s only island state comes with its own vehicular perils.

9. Colorado

Photo Credit: Wikimedia

Drivers Reporting History of DUI: 3.3%

Fatalities in Accidents Involving an Intoxicated Driver: 1,702

First Offense License Loss: Nine months

That famous Rocky Mountain High comes with an increased risk of accident due to drunk driving. With snow storms, winding passes and plenty of recreational traffic, Colorado’s roads can be a challenge in the best of times, but when you factor in the elevated incidence of drunk driving they become an even greater challenge. With stiff administrative penalties for first-time convictions, Colorado is doing its best to reduce the danger posed by DUI.

8. Minnesota

Photo Credit: Wikimedia

Drivers Reporting History of DUI: 3.7%

Fatalities in Accidents Involving an Intoxicated Driver: 1,442

First Offense License Loss: Three months to one year

It’s been reported that cold and dark climates contribute to alcohol abuse, which may explain Minnesota’s high ranking on this list. With the highest latitude of any of the Contiguous United States, Minnesota’s winters are not for the faint of heart. With 3.7% of auto insurance shoppers reporting a DUI in their past, it seems possible that the climate is taking a toll on Minnesota’s drivers.

7. Iowa

Photo Credit: Wikimedia

Drivers Reporting History of DUI: 3.8%

Fatalities in Accidents Involving an Intoxicated Driver: 968

First Offense License Loss: Six months

With just over three million residents, Iowa may not be the most populous state, but it is nonetheless home to a high proportion of inebriated drivers. The state has approximately 114,000 miles of public road—plenty of room for trouble when you consider that 3.8% of auto insurance shoppers report a DUI on their record.

6. Montana

Photo Credit: Wikimedia

Drivers Reporting History of DUI: 3.81%

Fatalities in Accidents Involving an Intoxicated Driver: 932

First Offense License Loss: Six months

Home to some of America’s most picturesque countryside, including the stunning Glacier National Park, Montana is also home to a large population of intoxicated drivers. Though it is one of America’s wildest states, the perils of getting behind the wheel intoxicated are no less severe in Montana than anywhere else.

5. Nebraska

Photo Credit: Wikimedia

Drivers Reporting History of DUI: 3.9%

Fatalities in Accidents Involving an Intoxicated Driver: 682

First Offense License Loss: Up to six months

Nebraska may sit at the center of the country, but it is among the top states for drunk driving. Though it’s known as the birthplace of the iconic drink Kool Aid, Nebraskans propensity to consume alcoholic beverages and take to the road is not a laughing matter. With 3.9% of its insurance shoppers admitting to a DUI, the Cornhusker State has plenty of room to improve road safety.

4. Wisconsin

Photo Credit: Wikimedia

Drivers Reporting History of DUI: 4.4%

Fatalities in Accidents Involving an Intoxicated Driver: 2,577

First Offense License Loss: Six to nine months

Known for their dairy production, unfortunately it seems that Wisconsinites are drinking more than milk. Ranking fourth on the list of states with a drunk driving problem, Wisconsin and its roads are more dangerous than most.

3. South Dakota

Photo Credit: Flickr

Drivers Reporting History of DUI: 5.6%

Fatalities in Accidents Involving an Intoxicated Driver: 537

First Offense License Loss: One month to one year

South Dakota’s Mount Rushmore and Badland National Park put the state high on the list of iconic tourist destinations. The annual Sturgis Motorcycle Rally brings over half a million motorcyclists to the state, but they’d best beware while in town - with 5.6% of insurance shoppers having had a DUI ticket or arrest, South Dakota presents drivers with an elevated risk of accident.

2. Wyoming

Photo Credit: Flickr

Drivers Reporting History of DUI: 6.5%

Fatalities in Accidents Involving an Intoxicated Driver: 506

First Offense License Loss: Three months

Usually associated with the natural wonders of Yellowstone National Park, Wyoming would likely prefer not to be known as the state with the second highest rate of DUI violations in the U.S. With more than 6% of auto insurance shoppers admitting to a DUI incident, Wyoming drivers rank second on the list of states with the highest prevalence of drunk driving.

1. North Dakota

Photo Credit: Wikimedia

Drivers Reporting History of DUI: 6.7%

Fatalities in Accidents Involving an Intoxicated Driver: 502

First Offense License Loss: Three to six months

The unfortunate designation of the state with the highest percentage of drivers with a DUI history goes to North Dakota. According to data on auto insurance shoppers and from the CDC’s survey of driving habits, North Dakota is the epicenter of America’s drunk driving problem. Drivers in this border state would be wise to drive defensively and, of course, never get behind the wheel after consuming too much alcohol.

Related to this collection

How to talk about alcohol and drugs with kids of all ages

How to talk about alcohol and drugs with kids of all ages

As informal as today's parents are compared with previous generations, there remains a handful of uncomfortable subjects. Alcohol and drug use is one of them.

Arizona Daily Star
  • Facebook
  • Twitter
  • Bluesky
  • YouTube
  • Instagram
  • Arizona Daily Star Store
  • This is Tucson
  • Saddlebag Notes
  • Tucson Festival of Books

Sites & Partners

  • E-edition
  • Classifieds
  • Events calendar
  • Careers @ Lee Enterprises
  • Careers @ Gannett
  • Online Features
  • Sponsored Blogs
  • Get Healthy

Services

  • Advertise with us
  • Register
  • Contact us
  • RSS feeds
  • Newsletters
  • Photo reprints
  • Subscriber services
  • Subscription FAQ
  • Licensing
  • Shopping
© Copyright 2026 Arizona Daily Star, PO Box 26887 Tucson, AZ 85726-6887
Terms of Use | Privacy Policy | Advertising Terms of Use | Do Not Sell My Info | Cookie Preferences
Powered by BLOX Content Management System from bloxdigital.com.
  • Notifications
  • Settings
You don't have any notifications.

Get up-to-the-minute news sent straight to your device.

Topics

News Alerts

Breaking News