

Interactive chart: 2013 Missouri MAP test scores
MAP scores by district and subject, 2009-2013
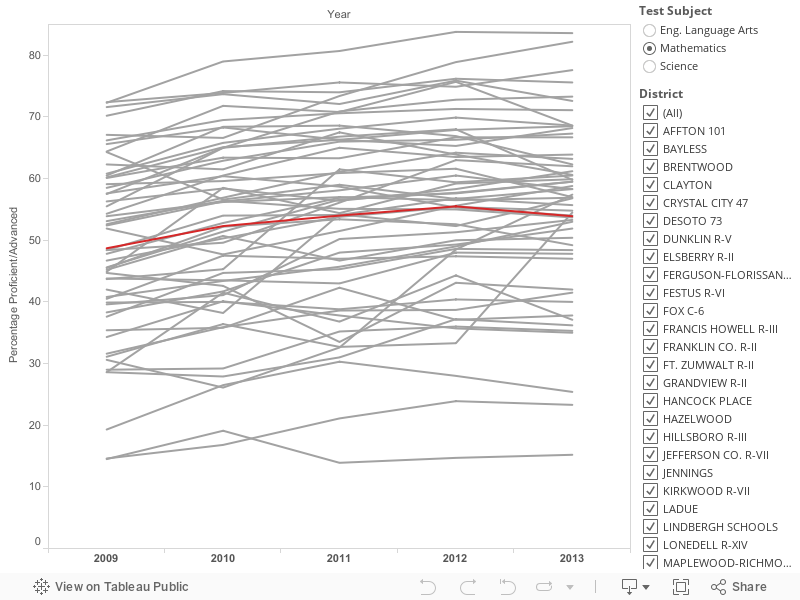
The above graph tracks the percentage of students in St. Louis area districts who scored at proficient or better on Missouri Assessment Program tests for English, math and science. The chart tracks the scores from 2009-2013. To highlight a specific district or test subject, make selections from the right-hand menu. The red line indicates overall scores for the entire state.
When looking at this data, it's important to consider that the number of schools within each district varies, and that there can also be a wide disparity between scores at schools within the same district.
For more details on each district and the schools within it, visit our searchable databases.
Source: Missouri Department of Elementary and Secondary Education.


