


Key highlights | |||
Operating results | 1Q26 | 1Q25 | |
Net income (loss) attributable to Alexandria's common stockholders – diluted: | |||
In millions | $ 358.9 | $ (11.6) | |
Per share | $ 2.10 | $ (0.07) | |
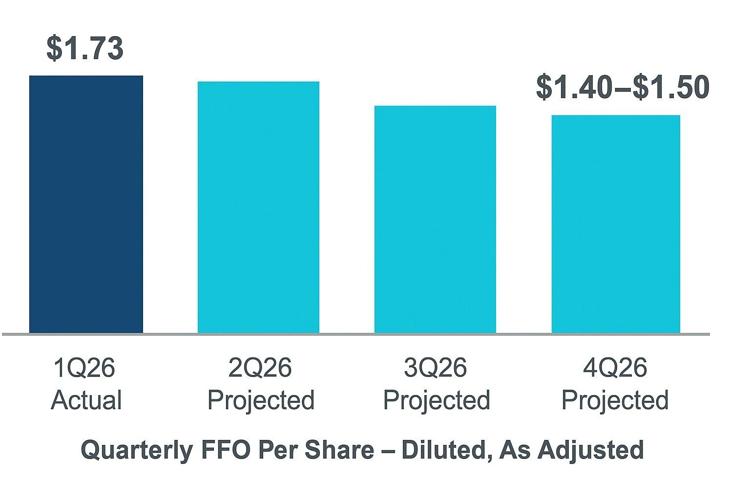
Funds from operations attributable to Alexandria's common stockholders – diluted, as adjusted: | |||
In millions | $ 295.9 | $ 392.0 | |
Per share | $ 1.73 | $ 2.30 | |
A best-in-class REIT with a high-quality, diverse tenant base, strong margins, and long lease terms
(As of March 31, 2026, unless stated otherwise) | |||
Occupancy of operating properties | 87.7 % | ||
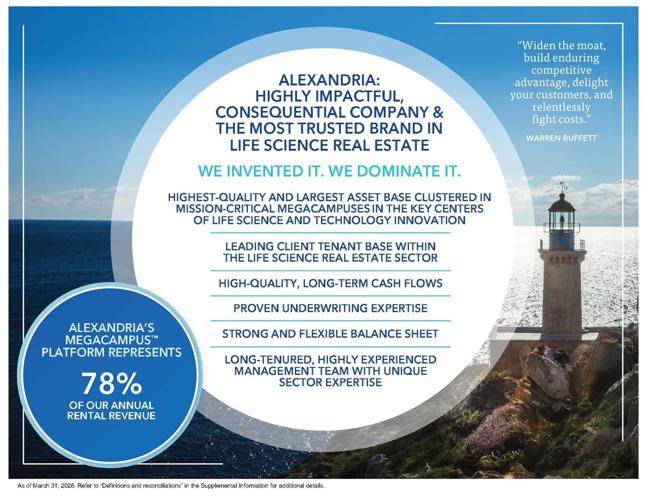
Percentage of annual rental revenue in effect from Megacampus™ platform | 78 % | ||
Percentage of annual rental revenue in effect from investment-grade or publicly | 55 % | ||
Operating margin | 67 % | ||
Adjusted EBITDA margin | 66 % | ||
Percentage of leases containing annual rent escalations | 97 % | ||
Weighted-average remaining lease term: | |||
Top 20 tenants | 9.9 | years | |
All tenants | 7.5 | years | |
Strong 1Q26 tenant collections(1): | |||
1Q26 rents and receivables collected as of April 27, 2026 | 99.9 % | ||
(1) Refer to "Tenant Collections" under "Definitions and reconciliations" in the Supplemental Information for | |||
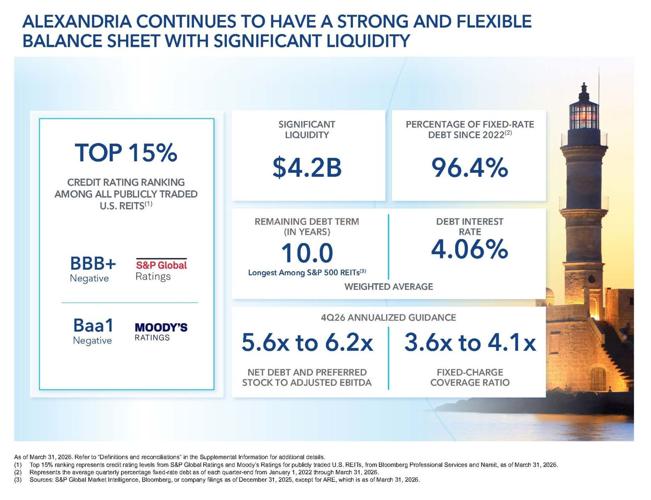
Strong and flexible balance sheet with significant liquidity; top 15% credit rating ranking among all publicly traded U.S. REITs
- $20.44 billion in total market capitalization.
- $7.92 billion in total equity capitalization.
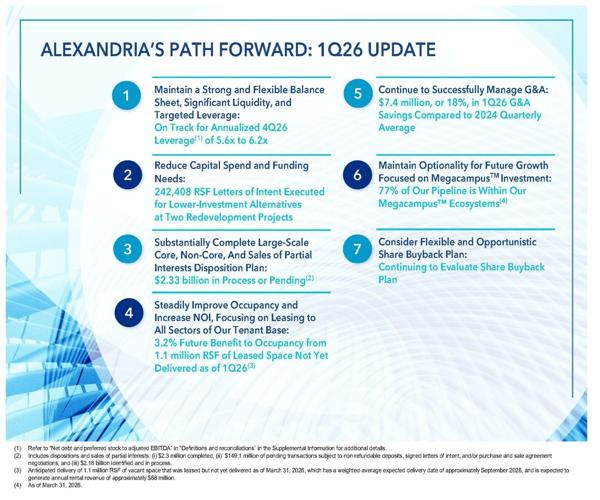
- Net debt and preferred stock to Adjusted EBITDA of 6.8x and fixed-charge coverage ratio of 3.4x for 1Q26 annualized, with 4Q26 annualized targets of 5.6x to 6.2x and 3.6x to 4.1x, respectively.
- We expect improvement in our quarter annualized net debt and preferred stock to Adjusted EBITDA ratio in 2H26 as we complete dispositions and sales of partial interests.
- As of March 31, 2026:
- Significant liquidity of $4.17 billion, or 3.7x of our debt maturities through 2028.
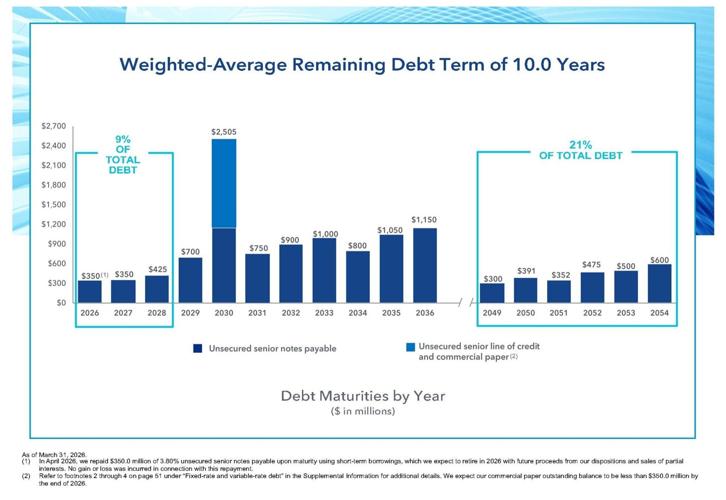
- Only 9% of our total debt matures through 2028.
- 10.0-year weighted-average remaining debt term, the longest among S&P 500 REITs.
- Total debt and preferred stock to gross assets of 31%.
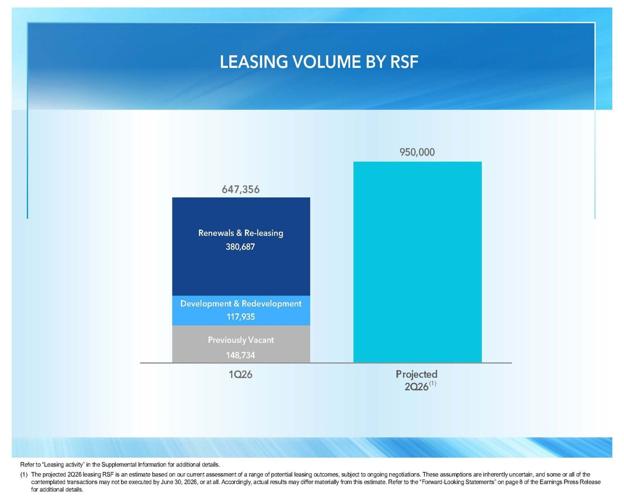
Solid leasing of development and redevelopment space
- Leasing volume of 647,356 RSF during 1Q26.
- 1Q26 leasing of development and redevelopment space aggregating 117,935 RSF, up 135%, from the prior five-quarter average, excluding a build-to-suit lease executed in July 2025 with a long-standing multinational pharmaceutical tenant.
- From April 1, 2026 through April 27, 2026, we have executed leases and/or letters of intent aggregating 276,188 RSF related to our development and redevelopment pipeline.
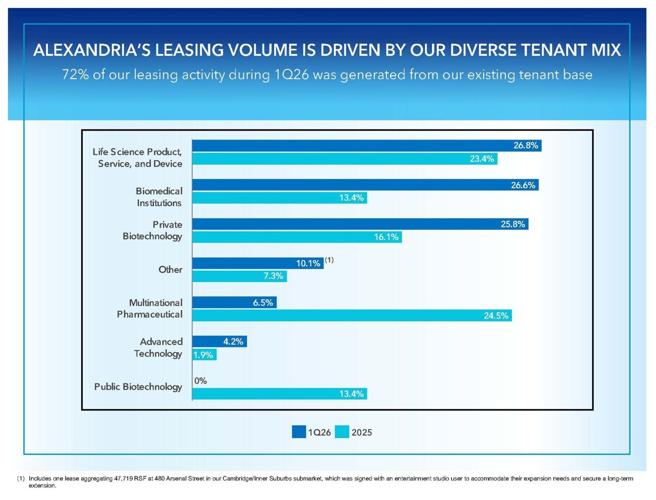
- 72% of our leasing activity during 1Q26 was generated from our existing tenant base.
- 1Q26 leasing of development and redevelopment space aggregating 117,935 RSF, up 135%, from the prior five-quarter average, excluding a build-to-suit lease executed in July 2025 with a long-standing multinational pharmaceutical tenant.
Leasing Activity in RSF: | 1Q26 | |||||
Leasing of development and redevelopment space | 117,935 | |||||
Leasing of previously vacant space | 148,734 | |||||
Lease renewals and re-leasing of space | 380,687 | |||||
647,356 | ||||||
Lease renewals and re-leasing of space: | ||||||
Rental rate changes | (15.0) % | |||||
Rental rate changes (cash basis) | (15.8) % |
- Excluding the impact of one lease aggregating 47,719 RSF at 480 Arsenal Street in our Cambridge/Inner Suburbs submarket, rental rates for renewed and re-leased space for 1Q26 would have decreased by 10.1% and 9.1% (cash basis). The space at 480 Arsenal Street was re-leased to an entertainment studio user to accommodate their expansion needs and secure a long-term extension. In addition, the reorientation of this building layout provides flexibility to market the remaining available space to a broader range of user demand.
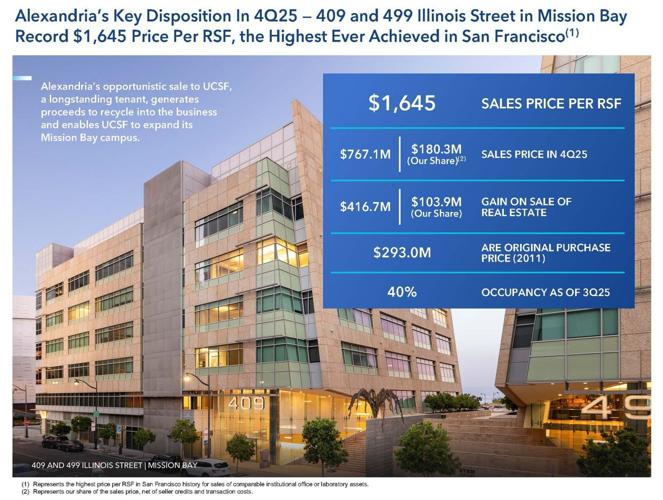
Ongoing execution of Alexandria's capital recycling strategy
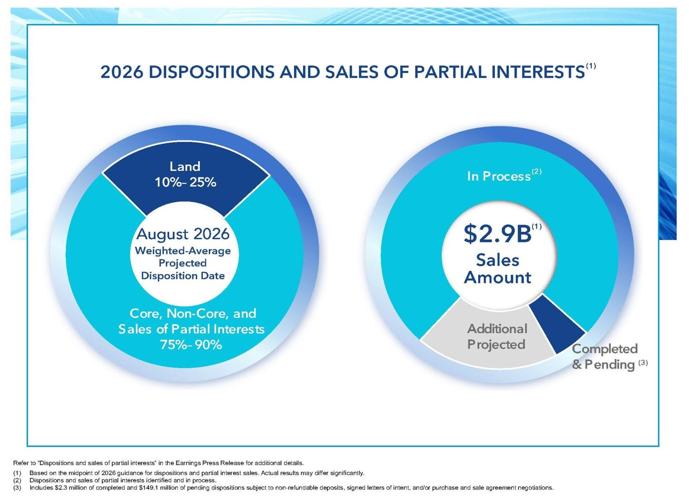
We plan to continue funding a significant portion of our capital requirements for the year ending December 31, 2026 through dispositions of land, non-core assets, and core assets (primarily sales of partial interests).
(dollars in millions) | Sales Price | % | ||
Completed and pending transactions subject to non-refundable deposits, | $ 151 | 5 % | ||
Identified and in process | 2,181 | 75 % | ||
Additional projected | 568 | 20 % | ||
2026 guidance midpoint for dispositions and sales of partial interests | $ 2,900 |
Occupancy and leasing progress on temporary vacancy
Operating occupancy as of December 31, 2025 | 90.9 % | ||
Reduction in occupancy related to previously disclosed 1Q26 key lease expirations | (1.9) | (1) | |
Other changes in occupancy | (1.3) | (2) | |
Operating occupancy as of March 31, 2026 | 87.7 | ||
Vacant space leased but not yet delivered | 3.2 | (3) | |
Operating occupancy as of March 31, 2026, including vacant space leased but not | 90.9 % | ||
(1) | Represents previously disclosed key lease expirations aggregating 657,492 RSF, with a weighted-average lease expiration date of January 2026 and prior annual rental revenue of approximately $41.6 million. These vacant spaces are currently 48% leased or under negotiation and the remaining 52% is being actively marketed for re-lease. |
(2) | Includes i) 139,408 RSF, or 0.4%, resulting from spaces vacated by tenants winding down operations, which are being actively marketed for re-lease and ii) delivery of 50,531 vacant RSF, or 0.2%, at our 10075 Barnes Canyon Road development project located at our SD Tech by Alexandria Megacampus. |
(3) | Represents temporary vacancies aggregating 1.1 million RSF, primarily in the Greater Boston, San Francisco Bay Area, and Seattle markets, that are leased and expected to be occupied upon completion of building and/or tenant improvements. The weighted-average expected delivery date is approximately September 2026, with expected annual rental revenue of approximately $68 million. |
Key operating metrics
Operating metrics | 1Q26 | ||
(dollars in millions) | |||
Net operating income (cash basis) | $ 1,672 | (1) | |
Decrease compared to 1Q25 | (15.2) % | (2) | |
Same property performance: | |||
Net operating income changes | (11.9) % | (3) | |
Net operating income changes (cash basis) | (11.7) % | (3) | |
Occupancy – current-period average | 88.9 % | ||
Occupancy – same-period prior-year average | 94.0 % |
(1) | Quarter annualized. |
(2) | Change in net operating income (cash basis) reflects the impact of operating properties disposed of after January 1, 2025. Excluding these dispositions, net operating income (cash basis), annualized, for the three months ended March 31, 2026, would have decreased by 8.9%. |
(3) | The quarter-over-quarter decline was due to a decrease in same property occupancy, primarily driven by the previously disclosed 2026 key lease expirations aggregating 657,492 RSF that became vacant during 1Q26, with a weighted-average lease expiration date of January 2026, and by vacancy in 4Q25 at one property aggregating 170,618 RSF at Alexandria Center® for Advanced Technologies – South San Francisco in our South San Francisco submarket. We expect our same property performance to improve in 2H26, primarily due to changes in same property occupancy, including the anticipated delivery of 1.1 million RSF of vacant space that was leased but not yet delivered as of March 31, 2026, which has a weighted-average expected delivery date of approximately September 2026, and is expected to generate annual rental revenue of approximately $68 million. |
Continued successful reduction and management of general and administrative expenses
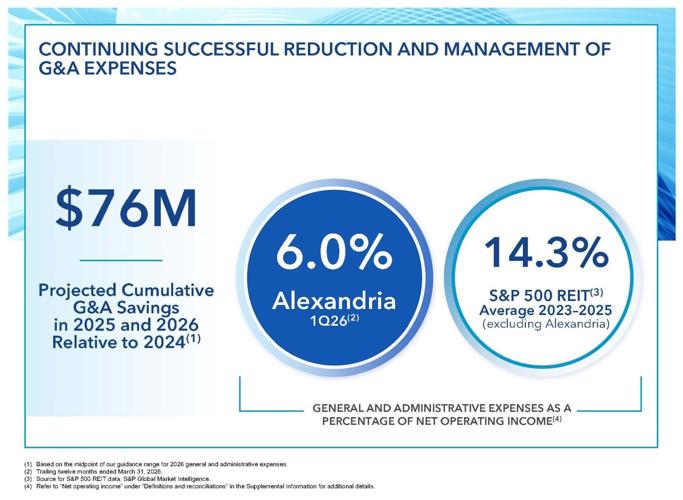
- General and administrative expenses for 1Q26 aggregated $34.7 million, which represents a decrease of $7.4 million, or 18%, compared to the quarterly average for 2024. For the trailing twelve months ended March 31, 2026, our general and administrative expenses as a percentage of net operating income were 6.0%, approximately half the average of other S&P 500 REITs for 2023-2025.
- In 2025, we achieved general and administrative expense reduction of $51.3 million, or 30%, compared to 2024, primarily as a result of cost-control and efficiency initiatives. Some of these cost savings were temporary, and we anticipate that approximately half of the cost reduction achieved in 2025 will continue in 2026.
Reduction of capital spend and funding needs
- We are evaluating the business and financial strategy for certain projects aggregating 1.6 million RSF to reduce future construction funding requirements within our active pipeline.
- Driven by demand for our Megacampuses and access to amenities at our 311 Arsenal Street and 3000 Minuteman Road redevelopment projects, we executed letters of intent aggregating 242,408 RSF in April 2026. These letters of intent are for lower-cost alternative uses for all or a portion of these projects, including advanced technology. If we are successful in executing these potential leases, we expect to evaluate whether all or a portion of these projects will be placed back into operation without the need to further redevelop.
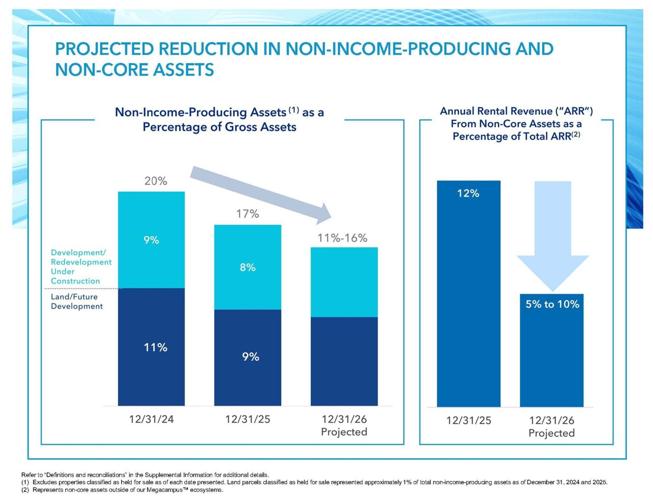
- Non-income-producing assets are 17% as a percentage of gross assets, a reduction of 3% since 4Q24; targeting a further reduction to 11% to 16% by 4Q26.
Alexandria's development and redevelopment pipeline is anticipated to deliver $92 million of incremental annual net operating income by 4Q26 primarily from projects that are 93% leased/negotiating
- Annual net operating income (cash basis) from recently delivered projects is expected to increase by $25 million upon the burn-off of initial free rent, which has a weighted-average remaining period of approximately four months.
- 77% of the RSF in our total development and redevelopment pipeline is within our Megacampus ecosystems.
Development and Redevelopment | Incremental Annual Net | RSF | Leased/ Percentage | |||||
(dollars in millions) | ||||||||
Expected to be placed into service: | ||||||||
2Q26 – 4Q26 | $ 92 | (1) | 601,589 | (2) | 93 % | (3) | ||
2027 – 2028 | 93 | 1,258,004 | 68 % | |||||
$ 185 | ||||||||
(1) | Includes expected partial deliveries through 2026 from projects expected to stabilize in 2027-2028, including speculative future leasing that is not yet fully committed. Refer to the initial and stabilized occupancy years under "New Class A/A+ development and redevelopment properties: under construction" in the Supplemental Information for additional details. |
(2) | Represents the RSF of projects expected to stabilize in 2026. Does not include RSF for partial deliveries through 2026 from projects expected to stabilize in 2027-2028. |
(3) | Represents the current leased/negotiating percentage of the 601,589 RSF of development and redevelopment projects that are expected to stabilize in 2026. |
Key capital events
- In February 2026, we completed tender offers to repurchase an aggregate debt principal amount of $1.33 billion across a portion of our outstanding 4.00% Senior Notes due 2050, 3.00% Senior Notes due 2051, and 3.55% Senior Notes due 2052. Cash consideration paid was $952.2 million. In connection with the debt repurchase, we recognized a gain on early extinguishment of debt of $366.4 million, including the write-off of unamortized debt issuance costs and other transaction-related costs.
- We funded the repurchase as follows:
- $750.0 million through the issuance of 5.25% unsecured senior notes due 2036; and
- Approximately $200 million through short-term borrowings under our commercial paper program, which will be repaid through planned dispositions and sales of partial interests included in our 2026 guidance.
- The repurchase reduced debt and improved leverage by approximately 0.2x.
- This transaction did not have a significant impact to our funds from operations per share diluted, as adjusted, interest expense, or fixed-charge coverage ratio.
- Following this transaction, our weighted-average remaining term of debt as of 1Q26 is 10.0 years, which continues to be the longest among S&P 500 REITs.
- We funded the repurchase as follows:
- In January 2026 and April 2026, we repaid, upon maturity, $300.0 million of 4.30% unsecured senior notes payable and $350.0 million of 3.80% unsecured senior notes payable, respectively. These repayments were funded temporarily with borrowings under our commercial paper program, which will be repaid through planned dispositions and sales of partial interests included in our 2026 guidance. No gain or loss was incurred in connection with these repayments.
- Under our common stock repurchase program authorized in December 2025, we may repurchase up to $500.0 million of our common stock through December 31, 2026. As of March 31, 2026, no shares have been repurchased.
Dividend strategy to share net cash flows from operating activities with stockholders while retaining a significant portion for reinvestment
- Common stock dividend declared of $0.72 per share for 1Q26, consistent with the preceding quarter. The declared dividend per common share reflects our commitment to maintaining the strength of our balance sheet, enhancing financial flexibility, preserving liquidity, and sharing cash flows with our stockholders.
- Significant net cash provided by operating activities, as adjusted, retained for reinvestment aggregating $2.60 billion for the years ended December 31, 2022 through 2025 and the midpoint of our 2026 guidance range.
- Dividend yield of 6.2% as of March 31, 2026 and dividend payout ratio of 42% for the three months ended March 31, 2026.
Investments
- As of March 31, 2026:
- Our non-real estate investments aggregated $1.54 billion.
- Unrealized gains presented in our consolidated balance sheet were $125.9 million, comprising gross unrealized gains and losses aggregating $191.5 million and $65.6 million, respectively.
- Investment loss of $4.6 million for 1Q26 presented in our consolidated statement of operations consisted of $18.2 million of realized gains, $10.3 million of unrealized losses, and $12.4 million of impairment charges.
2026 Guidance
March 31, 2026
(Dollars in millions, except per share amounts)
Guidance for 2026 has been updated to reflect our current view of existing market conditions and assumptions for the year ending December 31, 2026. There can be no assurance that actual results will not be materially higher or lower than these expectations. Our guidance for 2026 is subject to a number of variables and uncertainties. Refer to our discussion of "forward-looking statements" as well as our SEC filings, including our most recent annual report on Form 10-K and any subsequent quarterly reports on Form 10-Q.
Projected 2026 Funds From Operations per Share Attributable to Alexandria's Common Stockholders – Diluted | As of 4/27/26 | As of 1/26/26 | Key Changes | |||||||
Funds from operations per share, as adjusted(1) | $6.30 to $6.50 | $6.25 to $6.55 | No change to midpoint; range narrowed by 10 cents | |||||||
Midpoint | $6.40 | $6.40 | ||||||||
Key Credit Metrics Targets | As of 4/27/26 | As of 1/26/26 | Key Changes | |||
Net debt and preferred stock to Adjusted EBITDA – 4Q26 annualized | 5.6x to 6.2x | 5.6x to 6.2x | No Change | |||
Fixed-charge coverage ratio – 4Q26 annualized | 3.6x to 4.1x | 3.6x to 4.1x | ||||
As of 4/27/26 | As of 1/26/26 | |||||||||||
Key Sources and Uses of Capital | Range | Midpoint | Certain | |||||||||
Sources of capital: | ||||||||||||
Reduction in debt | $ (1,075) | $ (2,275) | $ (1,675) | See below | $ (1,675) | |||||||
Net cash provided by operating activities, as adjusted | 475 | 575 | 525 | 525 | ||||||||
Dispositions and sales of partial interests(2) | 2,100 | 3,700 | 2,900 | (2) | 2,900 | |||||||
Total sources of capital | $ 1,500 | $ 2,000 | $ 1,750 | $ 1,750 | ||||||||


