

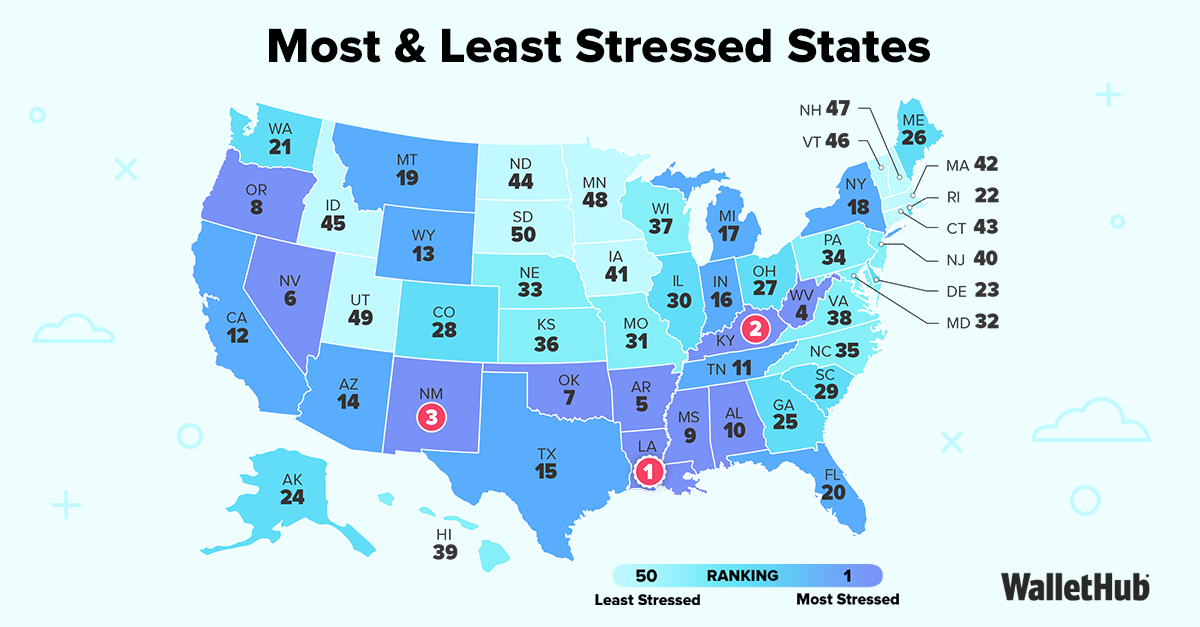

There are many different sources of stress, from inflation to work deadlines to relationship tensions. Last year, Americans’ biggest stressors included the future of the nation, the economy and work (for those employed), according to the American Psychological Association. These stressors are compounded by widespread feelings of loneliness and emotional disconnect, with nearly 70% of adults reporting they needed more emotional support than they received in the past year.
People are also reading…
WalletHub compared the 50 states across 40 key indicators of stress to help people determine where to live in order to achieve a more relaxing life. Our data set ranges from average hours worked per week to the personal bankruptcy rate to the share of adults getting adequate sleep.
 “There are plenty of small ways for people to manage stress, from staying active and participating in hobbies to taking vacations from work and getting help from a mental health professional. What many people don’t realize, though, is that changing location can also be a big stress reducer. For example, states that have lower crime rates, better health care and better economies tend to have much less stressed residents.”
Chip Lupo, WalletHub Analyst
Main Findings
Most Stressed States
| Overall Rank* | State | Total Score | Work-Related Stress Rank | Money-Related Stress Rank | Family-Related Stress Rank | Health- & Safety-Related Stress Rank |
|---|---|---|---|---|---|---|
| 1 | Louisiana | 62.86 | 1 | 3 | 6 | 2 |
| 2 | Kentucky | 58.18 | 3 | 7 | 4 | 6 |
| 3 | New Mexico | 57.65 | 29 | 5 | 1 | 13 |
| 4 | West Virginia | 56.20 | 13 | 4 | 17 | 3 |
| 5 | Arkansas | 55.60 | 33 | 2 | 25 | 1 |
| 6 | Nevada | 53.82 | 31 | 8 | 11 | 4 |
| 7 | Oklahoma | 53.47 | 24 | 10 | 10 | 8 |
| 8 | Oregon | 52.39 | 39 | 11 | 2 | 12 |
| 9 | Mississippi | 52.16 | 36 | 1 | 33 | 9 |
| 10 | Alabama | 50.99 | 43 | 6 | 14 | 10 |
| 11 | Tennessee | 50.35 | 34 | 13 | 23 | 5 |
| 12 | California | 49.65 | 8 | 18 | 5 | 31 |
| 13 | Wyoming | 49.30 | 2 | 16 | 40 | 18 |
| 14 | Arizona | 48.09 | 44 | 12 | 7 | 17 |
| 15 | Texas | 47.97 | 19 | 28 | 31 | 7 |
| 16 | Indiana | 47.96 | 21 | 17 | 29 | 19 |
| 17 | Michigan | 46.77 | 15 | 34 | 18 | 14 |
| 18 | New York | 46.51 | 5 | 32 | 3 | 45 |
| 19 | Montana | 46.44 | 46 | 9 | 24 | 22 |
| 20 | Florida | 46.16 | 40 | 19 | 8 | 27 |
| 21 | Washington | 46.09 | 16 | 48 | 9 | 11 |
| 22 | Rhode Island | 45.35 | 17 | 22 | 13 | 39 |
| 23 | Delaware | 45.07 | 6 | 30 | 21 | 35 |
| 24 | Alaska | 45.05 | 4 | 33 | 42 | 16 |
| 25 | Georgia | 45.00 | 28 | 20 | 37 | 20 |
| 26 | Maine | 44.14 | 48 | 15 | 16 | 21 |
| 27 | Ohio | 43.93 | 25 | 39 | 19 | 23 |
| 28 | Colorado | 43.90 | 11 | 35 | 27 | 29 |
| 29 | South Carolina | 43.85 | 41 | 21 | 32 | 25 |
| 30 | Illinois | 43.82 | 7 | 41 | 30 | 28 |
| 31 | Missouri | 43.61 | 30 | 29 | 38 | 15 |
| 32 | Maryland | 42.51 | 9 | 45 | 15 | 41 |
| 33 | Nebraska | 42.45 | 26 | 31 | 12 | 43 |
| 34 | Pennsylvania | 42.22 | 22 | 37 | 35 | 26 |
| 35 | North Carolina | 41.60 | 38 | 24 | 34 | 34 |
| 36 | Kansas | 41.28 | 12 | 25 | 48 | 24 |
| 37 | Wisconsin | 41.01 | 35 | 42 | 22 | 30 |
| 38 | Virginia | 40.82 | 20 | 49 | 20 | 36 |
| 39 | Hawaii | 39.14 | 14 | 26 | 41 | 49 |
| 40 | New Jersey | 38.17 | 10 | 46 | 39 | 44 |
| 41 | Iowa | 37.28 | 27 | 36 | 45 | 33 |
| 42 | Massachusetts | 36.54 | 32 | 44 | 28 | 50 |
| 43 | Connecticut | 36.46 | 37 | 38 | 36 | 46 |
| 44 | North Dakota | 35.84 | 18 | 40 | 44 | 48 |
| 45 | Idaho | 35.12 | 47 | 14 | 46 | 42 |
| 46 | Vermont | 33.77 | 50 | 27 | 26 | 47 |
| 47 | New Hampshire | 33.51 | 45 | 47 | 43 | 38 |
| 48 | Minnesota | 33.50 | 23 | 50 | 47 | 40 |
| 49 | Utah | 32.61 | 49 | 23 | 50 | 32 |
| 50 | South Dakota | 32.35 | 42 | 43 | 49 | 37 |
Notes: *No. 1 = Most Stressed With the exception of “Total Score,” the columns in the table above depict the relative rank of each state, and a rank of 1 represents the worst conditions for each category.
[edu-info-graphic metrics="[edu-info-metric img='https://cdn.wallethub.com/wallethub/posts/170184/metric-1.png' header='Avg. Hours Worked per Week' left='Most | 1. Alaska | T-2. Louisiana | T-2. Texas | 4. Mississippi | T-5. South Dakota | T-5. Wyoming' right='Fewest | T-44. New York | T-44. Massachusetts | 47. Oregon | 48. Rhode Island | 49. Vermont | 50. Utah'] || [edu-info-metric img='https://cdn.wallethub.com/wallethub/posts/170185/metric-2.png' header='Avg. Hours of Sleep per Night' left='Fewest | 1. Hawaii | 2. West Virginia | 3. Alabama | 4. Louisiana | T-5. Arkansas | T-5. Ohio' right='Most | 46. Oregon | 47. Nebraska | 48. Colorado | 49. Minnesota | 50. Vermont'] || [edu-info-metric img='https://cdn.wallethub.com/wallethub/posts/170186/metric-3.png' header='% of Adults in Fair/Poor Health' left='Highest | 1. West Virginia | 2. Arkansas | 3. Louisiana | 4. Kentucky | T-5. Mississippi | T-5. Tennessee' footer='Best State vs. Worst State: 2x Difference | West Virginia vs. Vermont' right='Lowest | 46. Minnesota | 47. North Dakota | 48. New Hampshire | 49. Massachusetts | 50. Vermont'] || [edu-info-metric img='https://cdn.wallethub.com/wallethub/posts/170187/metric-4.png' header='Job Security' left='Lowest | 1. Louisiana | 2. Wyoming | 3. West Virginia | 4. Iowa | 5. Colorado' right='Highest | 46. Nevada | 47. Mississippi | 48. Massachusetts | 49. Idaho | 50. Texas'] || [edu-info-metric img='https://cdn.wallethub.com/wallethub/posts/170188/metric-5.png' header='Credit Score' left='Lowest | 1. Mississippi | T-2. Alabama | T-2. Louisiana | 4. Texas | T-5. Georgia | T-5. Oklahoma' right='Highest | 46. Washington | 47. Wisconsin | 48. Vermont | 49. New Hampshire | 50. Minnesota'] || [edu-info-metric img='https://cdn.wallethub.com/wallethub/posts/170189/metric-6.png' header='Affordable Housing' left='Least | 1. California | 2. Hawaii | 3. New York | 4. Florida | 5. Nevada' footer='Best State vs. Worst State: 29x Difference | California vs. Iowa' right='Most | 46. Nebraska | 47. West Virginia | 48. North Dakota | 49. Kansas | 50. Iowa'] || [edu-info-metric img='https://cdn.wallethub.com/wallethub/posts/170190/metric-7.png' header='% of Population Living in Poverty' left='Highest | T-1. Mississippi | T-1. Louisiana | 3. New Mexico | 4. West Virginia | 5. Kentucky' footer='Best State vs. Worst State: 3x Difference | Mississippi vs. New Hampshire' right='Lowest | T-46. Maryland | T-46. Colorado | 48. Minnesota | 49. Utah | 50. New Hampshire'] || [edu-info-metric img='https://cdn.wallethub.com/wallethub/posts/170191/metric-8.png' header='Divorce Rate' left='Highest | 1. New Mexico | 2. Nevada | 3. Louisiana | 4. Mississippi | 5. Florida' footer='Best State vs. Worst State: 2x Difference | New Mexico vs. Utah' right='Lowest | 46. Hawaii | 47. Minnesota | 48. North Dakota | 49. New Jersey | 50. Utah'] || [edu-info-metric img='https://cdn.wallethub.com/wallethub/posts/170192/metric-9.png' header='Crime Rate per Capita' left='Highest | 1. New Mexico | 2. Colorado | 3. Tennessee | 4. Louisiana | 5. Arkansas' footer='Best State vs. Worst State: 18x Difference | New Mexico vs. New Hampshire' right='Lowest | 46. Connecticut | 47. Idaho | 48. Rhode Island | 49. Maine | 50. New Hampshire'] || [edu-info-metric img='https://cdn.wallethub.com/wallethub/posts/170193/metric-10.png' header='Psychologists per Capita' left='Fewest | 1. Mississippi | 2. Alabama | 3. Maine | 4. Hawaii | 5. Louisiana' footer='Best State vs. Worst State: 7x Difference | Mississippi vs. Massachusetts' right='Most | 46. Colorado | 47. Maryland | 48. Rhode Island | 49. New York | 50. Massachusetts']"]
In-Depth Look at the Most Stressed States Louisiana
Louisiana ranks as the most stressed state, in large part because it has the highest poverty rate in the country. Around 16% of residents haven’t seen a doctor in the past year due to the cost. In addition, Louisiana ranks among the 10 worst states for both the share of adults reporting poor mental health and the share of adults diagnosed with depression. Residents may also find it difficult to find someone to address mental health issues, since Louisiana has fewer psychologists per capita than most other states.
Lastly, the Bayou State had the eighth-highest average unemployment rate in the country last year, and it has the lowest job security than all states.
Kentucky
Kentucky has the second-most stressed residents, and many of the largest contributing factors are financial in nature. The state has the third-highest unemployment rate in the country, sixth-highest bankruptcy rate, and one of the lowest median credit scores, at 689. These difficult conditions will impact their financial capabilities for years to come.
Kentucky State residents experience a lot of stress in their family lives, too, with some of the highest rates of separation, divorce and parental stress in the country.
Finally, health is a big concern. Around 23% of Kentucky residents report that their health is “fair” or “poor,” the fourth-highest rate in the country. Additional indicators show that Kentucky has the 10th-largest share of adults with poor mental health and the second-largest share of adults diagnosed with depression. These figures highlight broader health challenges facing residents across the state.
New Mexico
New Mexico is the third-most stressed state, in large part because it has the second-highest violent crime rates per capita and highest property crime rates per capita. These types of threats cause residents to worry about their safety.
Residents of New Mexico also have the highest separation and divorce rate in the country, and the third-highest share of households that have a single parent. These conditions can put excess stress on children and parents alike.
Financial conditions in New Mexico also contribute to people’s stress levels. New Mexico has the second-highest poverty rate in the country, and residents have one of the lowest median credit scores, at just 692. Low incomes and low credit scores make it difficult for residents to get credit, purchase homes and vehicles, and otherwise improve their economic status.
For the best ways to cope with negative stressors, we turned to a panel of experts. You can read their bios and thoughts on the following key questions below.
- What tips do you have for fighting stress without spending money?
- What steps can people take to reduce their stress over finances?
- Should insurance companies cover treatments that help reduce stress?
- What tips do you have for parents trying to minimize their children’s stress levels?
- What can people do to address the financial stress caused by the current economic environment?
 Dr. Haiyong Liu Chair - Professor - Finance & Economics - Texas State University
 Cassandra D. Chaney Ph.D. – J. Franklin Bayhi Endowed Professor, Program in Human Development and Family Science (HDFS) in the School of Social Work, College of Human Sciences and Education - Louisiana State University
 Andrew Burnstine Ph.D. – Associate Professor, College of Business and Management - Lynn University
 Christian P. Neuman Ph.D., MBA – Assistant Professor of Marketing, Parker College of Business - Georgia Southern University
 David R. Kotok Co-Founder & Strategic Advisor, Cumberland Advisors
 Dana Anspach CFP®, RMA®, Kolbe CertifiedTM Consultant (6-5-8-2) – Founder and CEO – Sensible Money, LLC
More Experts
Methodology
In order to determine the most and least stressed states, WalletHub compared the 50 states across four key dimensions: 1) Work-Related Stress, 2) Money-Related Stress, 3) Family-Related Stress, 4) Health- & Safety-Related Stress.
We evaluated those dimensions using 40 relevant metrics, which are listed below with their corresponding weights. Each metric was graded on a 100-point scale, with a score of 100 representing the highest level of stress.
We then determined each state’s weighted average across all metrics to calculate its overall score and used the resulting scores to rank-order the states.
Work-Related Stress – Total Points: 25
- Average Hours Worked per Week: Double Weight (~5.26 Points)
- Average Commute Time: Half Weight (~1.32 Points)
- Average Leisure Time Spent per Day: Full Weight (~2.63 Points)
- Job Security: Full Weight (~2.63 Points)
- Unemployment Rate: Double Weight (~5.26 Points)
- Underemployment Rate: Full Weight (~2.63 Points)
- Income Growth Rate (2024 vs. 2023): Double Weight (~5.26 Points)
Money-Related Stress – Total Points: 25
- Median Income: Double Weight (~3.57 Points) Note: Adjusted for cost of living.
- Debt per Median Earnings: Full Weight (~1.79 Points)
- Median Credit Score: Full Weight (~1.79 Points)
- Personal Bankruptcy Rate: Double Weight (~3.57 Points)
- Share of Adults with Financial Anxiety: Double Weight (~3.57 Points) Note: This metric measures the percentage of adults who agree that thinking about their personal finances makes them feel anxious.
- Economic Security Score: Full Weight (~1.79 Points) Note: This metric is based on Sharecare’s “Community Well-Being Index", particularly the “Economic Security” element, defined as “community members who are employed, insured, and otherwise stable financially.”
- Share of People Unable to Save for Children’s College: Full Weight (~1.79 Points)
- Share of Adults Paying Only Minimum on Credit Card(s): Full Weight (~1.79 Points)
- Share of Population Living in Poverty: Full Weight (~1.79 Points)
- Housing Affordability: Double Weight (~3.57 Points) Note: This metric was calculated as follows: Housing Costs (accounts for both rental and sale prices) / Median Annual Household Income.
Family-Related Stress – Total Points: 25
- Separation and Divorce Rate: Full Weight (~2.78 Points)
- Share of Single Parents: Full Weight (~2.78 Points)
- Cost of Childcare: Triple Weight (~8.33 Points) Note: Adjusted for median household income.
- “Parental-Leave Policy” Score: Full Weight (~2.78 Points)
- Parental Stress: Full Weight (~2.78 Points) Note: This composite metric considers the percentage of parents who felt angry with their child, felt the child does things to bother them or felt the child is difficult to care for.
- Share of Parents Without Emotional Support: Full Weight (~2.78 Points) Note: This metric measures the percentage of parents who do not have someone they can turn to for day-to-day emotional support with parenting or raising children.
- Share of Parents Who Changed /Quit Jobs Due to Problems with Child Care: Full Weight (~2.78 Points)
Health- & Safety-Related Stress – Total Points: 25
- Share of Adults in Fair or Poor Health: Double Weight (~2.56 Points)
- Share of Adults Diagnosed with Depression: Full Weight (~1.28 Points)
- Mental Health: Double Weight (~2.56 Points)
- Suicide Rate: Full Weight (~1.28 Points)
- Unaffordability of Doctor Visits: Full Weight (~1.28 Points) Note: Measures percentage of adults aged 18 and older who reported not seeing a doctor in the past 12 months due to cost.
- Share of Parents Frustrated in Efforts to Get Health Services for Their Child: Full Weight (~1.28 Points) Note: This metric measures the share of parents frustrated in their efforts to get health services for their child in the past 12 months.
- Increase in Annual Health Insurance Premiums: Double Weight (~2.56 Points)
- Share of Insured Population: Double Weight (~2.56 Points) Note: “Population” includes noninstitutionalized civilians aged 16 and older.
- Psychologists per Capita: Full Weight (~1.28 Points)
- Physical Activity Rate: Half Weight (~0.64 Points)
- Share of Adults Getting Adequate Sleep: Full Weight (~1.28 Points) Note: Measures percentage of adults aged 18 and older who reported getting seven or more hours of sleep per 24-hour period.
- Bullying Incidents Rate: Full Weight (~1.28 Points) Note: Measures both the percentage of high school students who were bullied on school property and the percentage of high school students who were bullied electronically/online.
- Crime Rate per Capita: Full Weight (~1.28 Points)
- Hate-Crime Incidents per Capita: Full Weight (~1.28 Points)
- Well-Being Index: Full Weight (~1.28 Points)
- Quality of Infrastructure: Full Weight (~1.28 Points) Note: “Infrastructure” refers to roads and bridges.
Sources: Data used to create this ranking were collected as of February 23, 2026 from U.S. Census Bureau, Bureau of Labor Statistics, Centers for Disease Control and Prevention, FINRA Investor Education Foundation, Council for Community and Economic Research, Administrative Office of the United States Courts, TransUnion, U.S. Department of Housing and Urban Development, Child Care Aware of America, National Partnership for Women & Families, Sharecare’s “Community Well-Being Index”, Child and Adolescent Health Measurement Initiative, Federal Bureau of Investigation, Kaiser Family Foundation and The Road Information Program.
Supporting Video Files:


