

People are also reading…
Summer isn’t just a season for relaxing and taking vacations. For some people, especially young adults, the warmer months are a time to gain extra spending money or work experience. Fortunately, this summer is a great time to join the workforce. There’s a labor shortage, and many employers are eager to hire.
Naturally, summer job opportunities will be more widely available in some places than in others, and while a job may pay well in one city, the same position may not pay as much in another. Minimum-wage laws and local costs, for instance, will determine how much you earn and consequently what you’ll be able to afford in terms of housing, transportation and social activities.
With summer-job seekers in mind, WalletHub compared the relative strength of more than 180 markets in the U.S. across 21 key indicators of employment outlook, affordability and downtime-friendliness. Our data set ranges from the median income of part-time workers to the availability of summer jobs to the commuter-friendliness of jobs.

“It’s a great time to get a summer job, considering that a lot of places are still having labor shortages and may increase their compensation as a result. In addition to good pay and good work conditions, the best cities for summer jobs also have attractive features like short commute times and fun activities to engage in outside of work.”
Chip Lupo, WalletHub Analyst
Main Findings
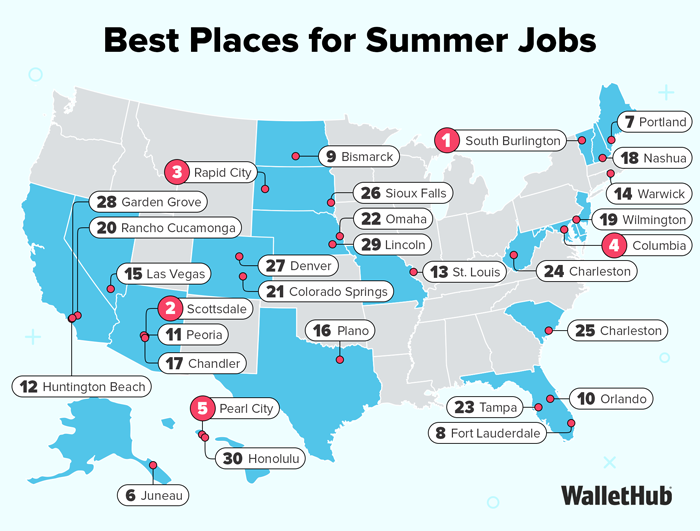
Best Places to Get a Summer Job
| Overall Rank | City | Total Score | Youth Job Market Rank | Social Environment & Affordability Rank |
|---|---|---|---|---|
| 1 | South Burlington, VT | 60.39 | 1 | 74 |
| 2 | Scottsdale, AZ | 59.99 | 2 | 13 |
| 3 | Rapid City, SD | 57.67 | 4 | 30 |
| 4 | Columbia, MD | 57.46 | 6 | 32 |
| 5 | Pearl City, HI | 56.34 | 5 | 54 |
| 6 | Juneau, AK | 55.51 | 7 | 61 |
| 7 | Portland, ME | 55.11 | 16 | 12 |
| 8 | Fort Lauderdale, FL | 55.08 | 12 | 14 |
| 9 | Bismarck, ND | 54.94 | 3 | 119 |
| 10 | Orlando, FL | 54.72 | 18 | 11 |
| 11 | Peoria, AZ | 53.50 | 9 | 91 |
| 12 | Huntington Beach, CA | 53.42 | 11 | 58 |
| 13 | St. Louis, MO | 53.40 | 30 | 9 |
| 14 | Warwick, RI | 52.55 | 15 | 53 |
| 15 | Las Vegas, NV | 52.52 | 41 | 10 |
| 16 | Plano, TX | 52.01 | 8 | 142 |
| 17 | Chandler, AZ | 51.65 | 21 | 59 |
| 18 | Nashua, NH | 51.27 | 10 | 125 |
| 19 | Wilmington, DE | 51.23 | 70 | 5 |
| 20 | Rancho Cucamonga, CA | 51.17 | 14 | 89 |
| 21 | Colorado Springs, CO | 50.90 | 39 | 27 |
| 22 | Omaha, NE | 50.81 | 40 | 28 |
| 23 | Tampa, FL | 50.71 | 42 | 29 |
| 24 | Charleston, WV | 50.63 | 24 | 64 |
| 25 | Charleston, SC | 50.31 | 13 | 134 |
| 26 | Sioux Falls, SD | 50.21 | 43 | 36 |
| 27 | Denver, CO | 50.17 | 88 | 8 |
| 28 | Garden Grove, CA | 50.13 | 28 | 65 |
| 29 | Lincoln, NE | 49.95 | 37 | 50 |
| 30 | Honolulu, HI | 49.80 | 95 | 4 |
| 31 | Boise, ID | 49.73 | 35 | 57 |
| 32 | Las Cruces, NM | 49.56 | 20 | 108 |
| 33 | Reno, NV | 49.55 | 61 | 26 |
| 34 | Mesa, AZ | 49.32 | 36 | 67 |
| 35 | Little Rock, AR | 49.11 | 22 | 136 |
| 36 | Austin, TX | 49.04 | 58 | 37 |
| 37 | Springfield, MO | 48.99 | 31 | 87 |
| 38 | Henderson, NV | 48.97 | 57 | 39 |
| 39 | Minneapolis, MN | 48.96 | 73 | 21 |
| 40 | Fargo, ND | 48.77 | 19 | 150 |
| 41 | Gilbert, AZ | 48.75 | 23 | 143 |
| 42 | Buffalo, NY | 48.66 | 77 | 24 |
| 43 | Billings, MT | 48.64 | 60 | 40 |
| 44 | Overland Park, KS | 48.42 | 38 | 86 |
| 45 | Knoxville, TN | 48.27 | 25 | 137 |
| 46 | Huntsville, AL | 48.25 | 27 | 128 |
| 47 | Modesto, CA | 48.03 | 54 | 66 |
| 48 | Richmond, VA | 47.87 | 51 | 75 |
| 49 | Tulsa, OK | 47.85 | 33 | 104 |
| 50 | Salt Lake City, UT | 47.79 | 52 | 73 |
| 51 | Tempe, AZ | 47.73 | 67 | 49 |
| 52 | St. Petersburg, FL | 47.72 | 83 | 38 |
| 53 | Kansas City, MO | 47.69 | 78 | 43 |
| 54 | Portland, OR | 47.65 | 123 | 7 |
| 55 | Anchorage, AK | 47.56 | 75 | 51 |
| 56 | St. Paul, MN | 47.52 | 81 | 44 |
| 57 | Seattle, WA | 47.44 | 137 | 3 |
| 58 | Nashville, TN | 47.38 | 34 | 120 |
| 59 | Chattanooga, TN | 47.31 | 32 | 133 |
| 60 | Cleveland, OH | 47.29 | 66 | 68 |
| 61 | Louisville, KY | 47.28 | 56 | 84 |
| 62 | Atlanta, GA | 47.26 | 82 | 48 |
| 63 | San Francisco, CA | 47.25 | 158 | 1 |
| 64 | Pittsburgh, PA | 47.12 | 87 | 46 |
| 65 | Phoenix, AZ | 46.86 | 104 | 22 |
| 66 | Miami, FL | 46.71 | 91 | 35 |
| 67 | Rochester, NY | 46.66 | 108 | 15 |
| 68 | Cincinnati, OH | 46.66 | 96 | 31 |
| 69 | Grand Prairie, TX | 46.64 | 17 | 182 |
| 70 | San Antonio, TX | 46.62 | 68 | 82 |
| 71 | Yonkers, NY | 46.61 | 74 | 70 |
| 72 | Oceanside, CA | 46.58 | 62 | 88 |
| 73 | Mobile, AL | 46.51 | 46 | 135 |
| 74 | Pembroke Pines, FL | 46.50 | 49 | 129 |
| 75 | Glendale, CA | 46.41 | 80 | 69 |
| 76 | Glendale, AZ | 46.37 | 55 | 107 |
| 77 | Sacramento, CA | 46.35 | 103 | 33 |
| 78 | Nampa, ID | 46.32 | 50 | 132 |
| 79 | Huntington, WV | 46.25 | 29 | 169 |
| 80 | Indianapolis, IN | 46.19 | 53 | 116 |
| 81 | Des Moines, IA | 46.10 | 64 | 97 |
| 82 | Cape Coral, FL | 46.01 | 89 | 55 |
| 83 | Lewiston, ME | 46.00 | 44 | 161 |
| 84 | Tucson, AZ | 45.93 | 124 | 17 |
| 85 | Albuquerque, NM | 45.85 | 97 | 45 |
| 86 | Akron, OH | 45.78 | 79 | 85 |
| 87 | Jersey City, NJ | 45.71 | 106 | 41 |
| 88 | Irvine, CA | 45.63 | 72 | 98 |
| 89 | Fort Wayne, IN | 45.59 | 47 | 159 |
| 90 | Ontario, CA | 45.49 | 65 | 117 |
| 91 | Oklahoma City, OK | 45.36 | 69 | 109 |
| 92 | Salem, OR | 45.31 | 93 | 62 |
| 93 | Fremont, CA | 45.18 | 86 | 94 |
| 94 | Cedar Rapids, IA | 45.03 | 76 | 111 |
| 95 | Irving, TX | 44.98 | 26 | 181 |
| 96 | Birmingham, AL | 44.66 | 59 | 160 |
| 97 | Boston, MA | 44.50 | 138 | 25 |
| 98 | Columbia, SC | 44.47 | 63 | 164 |
| 99 | Washington, DC | 44.44 | 171 | 2 |
| 100 | Oakland, CA | 44.43 | 147 | 18 |
| 101 | Amarillo, TX | 44.26 | 84 | 126 |
| 102 | Spokane, WA | 44.18 | 143 | 20 |
| 103 | Manchester, NH | 44.15 | 71 | 155 |
| 104 | San Diego, CA | 44.15 | 148 | 23 |
| 105 | Worcester, MA | 44.10 | 90 | 99 |
| 106 | Columbus, OH | 43.99 | 112 | 79 |
| 107 | Raleigh, NC | 43.78 | 98 | 100 |
| 108 | Bakersfield, CA | 43.76 | 100 | 95 |
| 109 | Virginia Beach, VA | 43.62 | 114 | 81 |
| 110 | Providence, RI | 43.59 | 125 | 56 |
| 111 | Jacksonville, FL | 43.52 | 126 | 63 |
| 112 | Garland, TX | 43.51 | 45 | 180 |
| 113 | Hialeah, FL | 43.40 | 48 | 177 |
| 114 | Long Beach, CA | 43.36 | 118 | 77 |
| 115 | Lexington-Fayette, KY | 43.33 | 85 | 158 |
| 116 | Tacoma, WA | 43.19 | 159 | 19 |
| 117 | Wichita, KS | 43.15 | 92 | 124 |
| 118 | Santa Rosa, CA | 43.04 | 127 | 72 |
| 119 | Anaheim, CA | 42.87 | 99 | 130 |
| 120 | Fort Smith, AR | 42.84 | 109 | 106 |
| 121 | Madison, WI | 42.76 | 115 | 96 |
| 122 | Vancouver, WA | 42.36 | 154 | 42 |
| 123 | San Bernardino, CA | 42.28 | 113 | 121 |
| 124 | Missoula, MT | 42.22 | 105 | 144 |
| 125 | Corpus Christi, TX | 42.13 | 101 | 152 |
| 126 | Houston, TX | 42.10 | 146 | 71 |
| 127 | Chicago, IL | 42.06 | 179 | 6 |
| 128 | Santa Ana, CA | 42.03 | 129 | 90 |
| 129 | Burlington, VT | 41.91 | 110 | 146 |
| 130 | Grand Rapids, MI | 41.88 | 157 | 47 |
| 131 | Durham, NC | 41.87 | 102 | 157 |
| 132 | Norfolk, VA | 41.76 | 128 | 101 |
| 133 | Charlotte, NC | 41.73 | 116 | 131 |
| 134 | West Valley City, UT | 41.70 | 111 | 153 |
| 135 | North Las Vegas, NV | 41.67 | 122 | 123 |
| 136 | Cheyenne, WY | 41.37 | 132 | 105 |
| 137 | Toledo, OH | 41.15 | 131 | 114 |
| 138 | Dallas, TX | 41.07 | 134 | 110 |
| 139 | Chesapeake, VA | 41.04 | 117 | 151 |
| 140 | Fontana, CA | 40.95 | 152 | 83 |
| 141 | Aurora, CO | 40.88 | 136 | 115 |
| 142 | Detroit, MI | 40.85 | 145 | 102 |
| 143 | Riverside, CA | 40.82 | 135 | 122 |
| 144 | Stockton, CA | 40.80 | 149 | 93 |
| 145 | Arlington, TX | 40.77 | 93 | 173 |
| 146 | Montgomery, AL | 40.54 | 107 | 170 |
| 147 | Los Angeles, CA | 40.27 | 178 | 16 |
| 148 | Santa Clarita, CA | 40.21 | 151 | 103 |
| 149 | Casper, WY | 40.16 | 139 | 138 |
| 150 | Newport News, VA | 40.09 | 133 | 154 |
| 151 | Moreno Valley, CA | 40.02 | 142 | 140 |
| 152 | New Orleans, LA | 39.89 | 164 | 80 |
| 153 | Fresno, CA | 39.72 | 144 | 149 |
| 154 | Milwaukee, WI | 39.60 | 169 | 78 |
| 155 | Winston-Salem, NC | 39.54 | 121 | 171 |
| 156 | Augusta, GA | 39.45 | 140 | 162 |
| 157 | Gulfport, MS | 39.38 | 150 | 148 |
| 158 | Greensboro, NC | 39.27 | 119 | 172 |
| 159 | Baltimore, MD | 39.21 | 174 | 60 |
| 160 | Fort Worth, TX | 39.11 | 141 | 166 |
| 161 | Newark, NJ | 39.10 | 175 | 52 |
| 162 | El Paso, TX | 39.02 | 156 | 141 |
| 163 | Port St. Lucie, FL | 38.71 | 160 | 139 |
| 164 | Brownsville, TX | 38.66 | 120 | 176 |
| 165 | Oxnard, CA | 38.65 | 162 | 112 |
| 166 | Dover, DE | 38.57 | 153 | 163 |
| 167 | Chula Vista, CA | 38.32 | 163 | 127 |
| 168 | New Haven, CT | 38.20 | 168 | 113 |
| 169 | San Jose, CA | 38.06 | 172 | 92 |
| 170 | Tallahassee, FL | 38.04 | 161 | 156 |
| 171 | Lubbock, TX | 37.72 | 130 | 178 |
| 172 | Shreveport, LA | 37.68 | 165 | 147 |
| 173 | Aurora, IL | 37.57 | 166 | 145 |
| 174 | Columbus, GA | 36.35 | 167 | 168 |
| 175 | Laredo, TX | 36.32 | 155 | 179 |
| 176 | Philadelphia, PA | 36.25 | 181 | 76 |
| 177 | Bridgeport, CT | 36.18 | 177 | 118 |
| 178 | Memphis, TN | 36.13 | 170 | 165 |
| 179 | New York, NY | 35.90 | 182 | 34 |
| 180 | Fayetteville, NC | 35.33 | 173 | 167 |
| 181 | Jackson, MS | 33.85 | 176 | 174 |
| 182 | Baton Rouge, LA | 32.01 | 180 | 175 |
Note: With the exception of “Total Score,” all of the columns in the table above depict the relative rank of each city, where a rank of 1 represents the best conditions for that metric.

- Highest Rate
- 1. South Burlington, VT
- 2. Fargo, ND
- 3. Sioux Falls, SD
- 4. Missoula, MT
- 5. Manchester, NH
- Lowest Rate
- 178. New York, NY
- 179. New Orleans, LA
- 180. Irvine, CA
- 181. Brownsville, TX
- 182. Fremont, CA

- Lowest Rate
- 1. Sioux Falls, SD
- 2. Madison, WI
- 3. Rapid City, SD
- 4. South Burlington, VT
- 5. Fargo, ND
- Highest Rate
- 178. Glendale, CA
- T-179. Newark, NJ
- T-179. Chula Vista, CA
- T-179. Shreveport, LA
- T-179. Detroit, MI

- Highest Income
- T-1. Scottsdale, AZ
- T-1. Bismarck, ND
- T-1. Columbia, MD
- T-1. Henderson, NV
- T-1. South Burlington, VT
- Lowest Income
- 178. Glendale, CA
- 179. Hialeah, FL
- 180. New York, NY
- 181. Burlington, VT
- 182. Garden Grove, CA

- Highest Availability
- T-1. Miami, FL
- T-1. Fort Lauderdale, FL
- 3. Richmond, VA
- 4. Honolulu, HI
- 5. Charleston, WV
- Lowest Availability
- 178. West Valley City, UT
- 179. Lincoln, NE
- 180. Lubbock, TX
- 181. North Las Vegas, NV
- 182. New York, NY

- Highest Availability
- T-1. Glendale, CA
- T-1. Pearl City, HI
- T-1. Fremont, CA
- T-1. Pembroke Pines, FL
- T-1. Jersey City, NJ
- Lowest Availability
- 177. Jackson, MS
- 178. Stockton, CA
- 179. Reno, NV
- 180. Lubbock, TX
- 181. Laredo, TX

- Lowest %
- 1. Pearl City, HI
- 2. Nashua, NH
- 3. Warwick, RI
- 4. Oceanside, CA
- 5. Fremont, CA
- Highest %
- 178. Baton Rouge, LA
- 179. Madison, WI
- 180. Columbia, SC
- 181. Tallahassee, FL
- 182. Burlington, VT

- Lowest Prices
- 1. Cedar Rapids, IA
- 2. Cheyenne, WY
- 3. Casper, WY
- 4. Wichita, KS
- 5. Fort Smith, AR
- Highest Prices
- 178. Jersey City, NJ
- T-179. Miami, FL
- T-179. Hialeah, FL
- 181. Boston, MA
- 182. New York, NY
In-Depth Look at the Best Cities for Summer Jobs
South Burlington, VT
South Burlington, VT, is the best city for summer employment, and it has the 16th-biggest “summer employment bump” in the country, which means that there are significantly more jobs available during the summer compared to other times of the year.
In addition, South Burlington has the sixth-most temporary job openings per capita, and ranks among the top cities for the number of jobs per capita that residents can access within a 30-minute commute.
Furthermore, South Burlington stands out with the highest percentage of part-time workers receiving health insurance coverage and has the fifth-highest median annual income for part-time workers, over $29,000.
Scottsdale, AZ
Scottsdale, AZ, is the second-best city for summer jobs, and it has the highest median income for part-time workers, over $34,000 per year, which means that summer employment should make people a decent chunk of cash.
Scottsdale also has a good employment outlook, with 28% more employers expecting to add employees than cut jobs. Therefore, it should be fairly easy to find a job.
To top things off, Scottsdale has the 22nd-most internship opportunities per capita and fifth-most part-time job openings per capita.
Rapid City, SD
Rapid City, SD, is the third-best city for summer jobs, boasting second biggest summer employment bump in the country. This means job seekers are more likely to find opportunities during the summer months, making it an attractive spot for temporary work.
The city also offers a solid employment landscape overall, with the third-lowest unemployment rate and the 15th-highest labor force participation. In addition, Rapid City has the 32nd highest number of part-time job openings per capita, further improving the chances of landing a role.
Finally, Rapid City has the 14th-lowest annual cost of transportation for part-time workers. Lower commuting costs can make a real difference, allowing workers to keep more of what they earn over the summer.
Ask the Experts

Ph.D. – Associate Professor, College of Business and Management - Lynn University
Read More

MS, MBA, AMA-CPM, AMA-PCM, CAPM, FMVA - Assistant Professor of Practice, Entrepreneurship, Director, Joseph C. Prince Entrepreneurship Program, Stetson University
Read More

Director of Career Services - Rasmussen University - Central Services
Read More

Ph.D., LPCC, NCC, Executive Director for Student Resources, Acting Director for Career Services, Division of Student Affairs - The University of New Mexico
Read More

M.Ed., Director of Career and Industry Engagement, Experiential Learning and Professional Engagement (ELPE), Swanson School of Engineering - University of Pittsburgh
Read More

Director, Career & Professional Development – Southern Utah University
Read More
Methodology
In order to determine the best cities for summer jobs, WalletHub compared 182 cities — including the 150 most populated U.S. cities, plus at least two of the most populated cities in each state — across two key dimensions, “Youth Job Market” and “Social Environment & Affordability.” Our sample considers only the city proper in each case and excludes cities in the surrounding metro area.
We evaluated the two dimensions using 21 relevant metrics, which are listed below with their corresponding weights. Each metric was graded on a 100-point scale, with a score of 100 representing the most favorable conditions for individuals seeking summer work.
We then determined each city’s weighted average across all metrics to calculate its overall score and used the resulting scores to rank-order our sample.
Youth Job Market – Total Points: 75
- Availability of Summer Jobs: Full Weight (~5.36 Points)
Note: This metric measures the number of part-time and temporary jobs per total civilian population aged 16 to 24 in the labor force. - Availability of Internships: Double Weight (~10.71 Points)
Note: This metric measures the number of internship listings per total civilian population aged 16 to 24 in the labor force. - Summer Employment Growth: Double Weight (~10.71 Points)
Note: This metric measures the change in employment during summer 2025 and during summer 2024. - Summer Employment Bump: Double Weight (~10.71 Points)
Note: This metric measures the difference in employment during summer versus year-round. A higher difference favors summer employment. - Labor-Force Participation Rate of Population Aged 16 to 24: Full Weight (~5.36 Points)
- Unemployment Rate of Population Aged 16 to 24: Full Weight (~5.36 Points)
- Underemployment Rate: Full Weight (~5.36 Points)
- Net Employment Outlook: Full Weight (~5.36 Points)
Note: This metric measures the percentage of employers who expect to add employees minus the percentage who expect to have fewer, according to the Manpower Employment Outlook Survey. - Ratio of Part-Time Workers to Full-Time Workers: Full Weight (~5.36 Points)
Note: This metric measures the number of part-time employees per 100 full-time employees. - Median Income of Part-Time Workers: Full Weight (~5.36 Points)
Note: This metric was adjusted for the cost of living. - Share of Insured Part-Time Workers: Full Weight (~5.36 Points)
Note: “Insured” refers to those with health-insurance coverage.
Social Environment & Affordability – Total Points: 25
- Share of Population Aged 16 to 24: Full Weight (~2.50 Points)
- Share of Population Aged 16 to 24 in Poverty: Full Weight (~2.50 Points)
- Minimum Wage: Full Weight (~2.50 Points)
Note: Data for this metric were available at the state level only. - Rental Price as Share of Median Income: Full Weight (~2.50 Points)
Note: This metric measures the rental price for a one-bedroom property as a share of the median income of part-time workers. - Access to Public Transportation: Full Weight (~2.50 Points)
Note: This metric measures the percentage of commuters who use public transit. - Commuter-Friendliness of Jobs: Full Weight (~2.50 Points)
Note: This metric measures the number of jobs accessible by a 30-minute transit ride per total civilian employed population. - Annual Costs of Public Transportation Pass for Part-Time Workers: Full Weight (~2.50 Points)
Note: This metric measures annual costs of public transportation pass as a share of the median income of part-time workers. - Fun-Friendliness: Full Weight (~2.50 Points)
Note: This metric is based on WalletHub’s “Most Fun Cities in America” ranking. - Active-Lifestyle-Friendliness: Full Weight (~2.50 Points)
Note: This metric is based on WalletHub’s “Best & Worst Cities for an Active Lifestyle” ranking. - Singles-Friendliness: Full Weight (~2.50 Points)
Note: This metric is based on WalletHub’s “Best & Worst Cities for Singles” ranking.
Sources: Data used to create this ranking were collected as of April 22, 2026 from the U.S. Census Bureau, Bureau of Labor Statistics, ManpowerGroup, Chmura Economics & Analytics, Council for Community and Economic Research, Indeed.com, U.S. Department of Housing and Urban Development, National Conference of State Legislatures, Numbeo, Center for Neighborhood Technology and WalletHub research.


