

People are also reading…
Growing up is hard, and without a stable home, positive role models and enough financial and educational resources, many young Americans fall behind their peers and experience a rocky transition to adulthood. For example, 13% of individuals between the ages of 18 and 24 are neither working nor attending school. Others suffer from poor health conditions that hinder their ability to develop physically or socially. In addition, research shows that when youth grow up in environments with economic problems and a lack of role models, they’re more at risk for poverty, early pregnancy and violence, into adulthood.
To determine the places where young Americans are not faring as well as others in the same age group, WalletHub compared the 50 states and the District of Columbia across 15 key indicators of youth risk. Our data set ranges from the share of disconnected youth to the labor force participation rate among young adults to the youth poverty rate.

“A high share of youth who are not working, not getting education and generally stagnating in life can spell trouble for the future. States that are most impacted by this problem, as well as related issues like high youth poverty rates, widespread drug use and low test scores, need a wake-up call to invest more into improving conditions for young residents. Otherwise, the future economic and social progress of the state is in danger.”
Chip Lupo, WalletHub Analyst
Main Findings
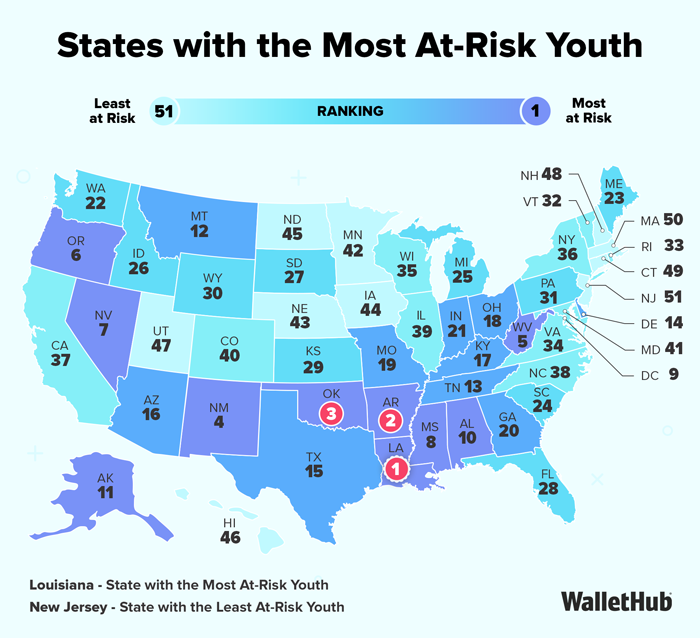
States with the Most At-Risk Youth
| Overall Rank* | State | Total Score | Education & Employment Rank | Health Rank |
|---|---|---|---|---|
| 1 | Louisiana | 64.04 | 2 | 10 |
| 2 | Arkansas | 60.38 | 7 | 6 |
| 3 | Oklahoma | 60.18 | 8 | 7 |
| 4 | New Mexico | 59.72 | 3 | 15 |
| 5 | West Virginia | 59.60 | 9 | 5 |
| 6 | Oregon | 59.29 | 13 | 2 |
| 7 | Nevada | 56.12 | 5 | 22 |
| 8 | Mississippi | 55.07 | 1 | 48 |
| 9 | District of Columbia | 55.05 | 4 | 26 |
| 10 | Alabama | 54.23 | 10 | 14 |
| 11 | Alaska | 53.10 | 6 | 34 |
| 12 | Montana | 53.08 | 33 | 1 |
| 13 | Tennessee | 52.59 | 15 | 11 |
| 14 | Delaware | 50.22 | 21 | 9 |
| 15 | Texas | 48.19 | 12 | 32 |
| 16 | Arizona | 47.96 | 18 | 21 |
| 17 | Kentucky | 47.64 | 16 | 24 |
| 18 | Ohio | 46.26 | 22 | 18 |
| 19 | Missouri | 46.21 | 25 | 13 |
| 20 | Georgia | 45.95 | 11 | 43 |
| 21 | Indiana | 45.80 | 23 | 19 |
| 22 | Washington | 45.24 | 27 | 17 |
| 23 | Maine | 44.80 | 45 | 3 |
| 24 | South Carolina | 44.09 | 14 | 46 |
| 25 | Michigan | 43.76 | 26 | 23 |
| 26 | Idaho | 42.11 | 20 | 37 |
| 27 | South Dakota | 41.81 | 17 | 45 |
| 28 | Florida | 41.75 | 19 | 44 |
| 29 | Kansas | 41.49 | 29 | 29 |
| 30 | Wyoming | 41.07 | 31 | 27 |
| 31 | Pennsylvania | 40.81 | 37 | 16 |
| 32 | Vermont | 39.75 | 46 | 8 |
| 33 | Rhode Island | 38.87 | 43 | 12 |
| 34 | Virginia | 38.42 | 35 | 35 |
| 35 | Wisconsin | 38.22 | 41 | 20 |
| 36 | New York | 38.06 | 24 | 47 |
| 37 | California | 37.94 | 30 | 39 |
| 38 | North Carolina | 37.65 | 32 | 40 |
| 39 | Illinois | 36.96 | 39 | 28 |
| 40 | Colorado | 36.78 | 38 | 33 |
| 41 | Maryland | 36.35 | 34 | 42 |
| 42 | Minnesota | 33.97 | 47 | 25 |
| 43 | Nebraska | 33.78 | 40 | 38 |
| 44 | Iowa | 32.37 | 42 | 36 |
| 45 | North Dakota | 31.96 | 49 | 31 |
| 46 | Hawaii | 31.78 | 28 | 51 |
| 47 | Utah | 31.57 | 36 | 49 |
| 48 | New Hampshire | 31.41 | 51 | 4 |
| 49 | Connecticut | 29.27 | 50 | 30 |
| 50 | Massachusetts | 29.19 | 48 | 41 |
| 51 | New Jersey | 24.00 | 44 | 50 |
Notes: *No. 1 = Most at Risk
With the exception of “Total Score,” all of the columns in the table above depict the relative rank of that state, where a rank of 1 represents the worst conditions for that metric category.

- Highest
- T-1. Louisiana
- T-1. Mississippi
- T-1. Nevada
- 4. Arkansas
- T-5. Alaska
- T-5. West Virginia
- Lowest
- 47. Minnesota
- 48. Massachusetts
- 49. Rhode Island
- 50. North Dakota
- 51. New Hampshire

- Highest
- 1. New Mexico
- 2. Oklahoma
- 3. South Dakota
- 4. Georgia
- 5. Arizona
- Lowest
- T-46. Massachusetts
- T-46. Virginia
- 48. New Hampshire
- 49. Connecticut
- 50. District of Columbia
- 51. Hawaii

- Highest
- 1. Arkansas
- 2. West Virginia
- 3. Alabama
- 4. New Mexico
- 5. Arizona
- Lowest
- 47. New Jersey
- 48. Utah
- 49. District of Columbia
- 50. Colorado
- 51. Massachusetts

- Highest
- 1. Maine
- 2. Vermont
- 3. Montana
- 4. District of Columbia
- 5. Massachusetts
- Lowest
- 47. Texas
- 48. Nebraska
- 49. South Dakota
- 50. Utah
- 51. Alabama

- Lowest
- 1. Mississippi
- 2. New York
- 3. New Jersey
- 4. California
- 5. Louisiana
- Highest
- 44. North Dakota
- 45. Utah
- 46. Kansas
- 47. Wisconsin
- 48. Minnesota

- Highest
- 1. District of Columbia
- 2. Louisiana
- 3. West Virginia
- 4. North Dakota
- 5. Mississippi
- Lowest
- 47. Nevada
- 48. Connecticut
- 49. Alaska
- 50. New Jersey
- 51. New Hampshire

- Highest
- T-1. Alaska
- T-1. District of Columbia
- T-1. New York
- T-1. Oregon
- 5. Washington
- Lowest
- 47. Iowa
- 48. Kansas
- 49. Virginia
- 50. Alabama
- 51. Mississippi
In-Depth Look at the States With the Most At-Risk Youth
Louisiana
Louisiana is the state with the most at-risk youth, largely because it has the highest share of people ages 18 to 24 who are not attending school or working and have no degree beyond high school. This represents 16.6% of young adults in the state.
In addition, Louisiana has the seventh-highest share of people ages 18 to 24 without a high school diploma, at 13.8%. For comparison, the lowest percentage of any state is around half that amount.
To add to these problems, Louisiana has the second-highest youth poverty rate and the third-highest teen birth rate in the country, both of which make it increasingly difficult for young people to improve their financial status.
Arkansas
Arkansas has the second-most at-risk youth, and one of its biggest issues is that it has the second-highest share of people ages 18 to 24 who are neither attending school nor participating in the workforce and have not pursued education beyond high school, at 16.2%, which severely limits their earning potential and hireability.
One reason why so many youth drop out of school in Arkansas is likely the fact that the state has poor performance overall when it comes to education. Only 20% of eighth graders in the state perform at or above proficiency level for math, according to the National Assessment of Educational Progress, and only 25% do so for reading.
Many young adults in Arkansas are not doing well physically, either, as over 62% are overweight or obese, the highest rate in the nation.
Oklahoma
Oklahoma has the third-most at-risk youth in the country, and 14.6% of people ages 18 to 24 in the state have no high school diploma, the second-highest percentage in the country. Oklahoma also has the fifth-highest rate of young who are not attending school or working and have no degree beyond high school.
In addition, youth in Oklahoma are below-level in their education. Only 17% of eighth-graders demonstrate proficiency in math, and just 20% do so in reading, the second-lowest percentages in the country.
Finally, Oklahoma has the second-highest rate of young adults who are limited in any activities because of physical, mental, or emotional problems, at over 29%.
Share of Disconnected Youth Over Time


The methodology can be found on the full version of the article on WalletHub.


