

People are also reading…
Staying active is good for your wallet as well as your health. One of the best ways to maintain an active lifestyle is to choose a city that encourages and facilitates recreation. The best cities have a wide range of leisure activities, both indoor and outdoor, which require varying levels of exercise and contribute to a city’s overall well-being and economy.
Neighborhood parks are one of the most beneficial places for recreation a city can offer. Having a park within 600 feet of your property can have a significant impact on its value. In addition, parks help people stay fit, saving them an average of nearly $2,300 in health care costs per year, and they reduce the overall cost of air pollution by $3.8 billion per year. It’s also important for cities to offer recreation opportunities that don’t require good weather. Therefore, places like movie theaters, music venues and coffee shops contribute to each city’s recreation-friendliness, too.
To identify the best areas for recreation, WalletHub compared the 100 largest U.S. cities across 47 key metrics that speak to the benefits of recreational activities. In each city, we examined the availability and cost of recreational activities, along with the quality of parks and the weather.

“Recreation is an important factor to consider when moving to a new city. Without adequate space for activities you enjoy, your mental health will suffer. In addition, a lack of green spaces or indoor places to exercise can make it hard to stay fit and take care of your physical health. The best cities for recreation have a wide variety of indoor and outdoor activities that can help people of all ages stay entertained and active.”
Chip Lupo, WalletHub Analyst
Main Findings
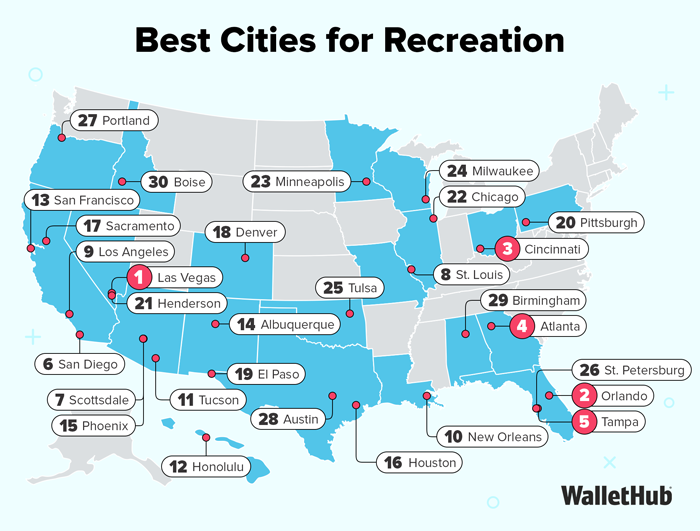
Best Cities for Recreation
Overall Rank | City | Total Score | Entertainment & Recreational Facilities Rank | Costs Rank | Quality of Parks Rank | Weather Rank |
|---|---|---|---|---|---|---|
| 1 | Las Vegas, NV | 67.12 | 1 | 37 | 25 | 18 |
| 2 | Orlando, FL | 62.28 | 2 | 47 | 55 | 28 |
| 3 | Cincinnati, OH | 62.10 | 12 | 1 | 7 | 58 |
| 4 | Atlanta, GA | 61.09 | 6 | 55 | 20 | 41 |
| 5 | Tampa, FL | 58.68 | 11 | 51 | 86 | 13 |
| 6 | San Diego, CA | 57.08 | 4 | 85 | 40 | 34 |
| 7 | Scottsdale, AZ | 56.20 | 33 | 59 | 24 | 3 |
| 8 | St. Louis, MO | 56.18 | 15 | 11 | 16 | 94 |
| 9 | Los Angeles, CA | 55.81 | 5 | 89 | 72 | 7 |
| 10 | New Orleans, LA | 55.00 | 21 | 75 | 1 | 53 |
| 11 | Tucson, AZ | 54.67 | 32 | 22 | 73 | 16 |
| 12 | Honolulu, HI | 54.38 | 7 | 94 | 9 | 43 |
| 13 | San Francisco, CA | 53.95 | 3 | 98 | 6 | 49 |
| 14 | Albuquerque, NM | 53.91 | 45 | 15 | 28 | 37 |
| 15 | Phoenix, AZ | 53.55 | 28 | 57 | 67 | 17 |
| 16 | Houston, TX | 53.43 | 19 | 23 | 32 | 86 |
| 17 | Sacramento, CA | 53.41 | 37 | 72 | 12 | 9 |
| 18 | Denver, CO | 52.78 | 13 | 79 | 14 | 64 |
| 19 | El Paso, TX | 52.54 | 62 | 5 | 36 | 25 |
| 20 | Pittsburgh, PA | 52.20 | 18 | 34 | 45 | 84 |
| 21 | Henderson, NV | 52.19 | 75 | 6 | 63 | 4 |
| 22 | Chicago, IL | 52.14 | 9 | 78 | 19 | 92 |
| 23 | Minneapolis, MN | 51.96 | 27 | 39 | 11 | 77 |
| 24 | Milwaukee, WI | 51.90 | 29 | 9 | 17 | 95 |
| 25 | Tulsa, OK | 51.78 | 53 | 7 | 62 | 30 |
| 26 | St. Petersburg, FL | 51.74 | 31 | 44 | 57 | 40 |
| 27 | Portland, OR | 51.68 | 16 | 69 | 22 | 78 |
| 28 | Austin, TX | 51.53 | 17 | 41 | 65 | 81 |
| 29 | Birmingham, AL | 51.09 | 47 | 17 | 13 | 59 |
| 30 | Boise, ID | 50.99 | 55 | 35 | 44 | 26 |
| 31 | Kansas City, MO | 50.57 | 50 | 19 | 52 | 44 |
| 32 | St. Paul, MN | 50.28 | 38 | 8 | 29 | 69 |
| 33 | San Bernardino, CA | 50.15 | 94 | 31 | 43 | 8 |
| 34 | Fort Worth, TX | 49.74 | 63 | 29 | 41 | 32 |
| 35 | San Antonio, TX | 49.74 | 24 | 10 | 85 | 74 |
| 36 | Glendale, AZ | 49.42 | 71 | 28 | 82 | 11 |
| 37 | Irvine, CA | 49.25 | 58 | 84 | 5 | 21 |
| 38 | North Las Vegas, NV | 49.16 | 88 | 3 | 49 | 5 |
| 39 | Philadelphia, PA | 49.07 | 22 | 82 | 46 | 52 |
| 40 | Jacksonville, FL | 48.66 | 30 | 56 | 39 | 67 |
| 41 | Dallas, TX | 48.36 | 25 | 68 | 27 | 72 |
| 42 | Norfolk, VA | 48.33 | 51 | 43 | 23 | 62 |
| 43 | Riverside, CA | 48.33 | 64 | 40 | 99 | 1 |
| 44 | Reno, NV | 48.17 | 46 | 46 | 89 | 27 |
| 45 | Baton Rouge, LA | 47.81 | 42 | 27 | 75 | 54 |
| 46 | Louisville, KY | 47.74 | 26 | 25 | 76 | 91 |
| 47 | Cleveland, OH | 47.73 | 36 | 16 | 51 | 83 |
| 48 | Oklahoma City, OK | 47.72 | 59 | 14 | 92 | 35 |
| 49 | Lincoln, NE | 47.50 | 65 | 61 | 21 | 46 |
| 50 | Chandler, AZ | 47.49 | 90 | 32 | 60 | 14 |
| 51 | New York, NY | 47.28 | 10 | 100 | 8 | 55 |
| 52 | Detroit, MI | 47.27 | 69 | 12 | 34 | 60 |
| 53 | Long Beach, CA | 46.99 | 41 | 88 | 48 | 12 |
| 54 | Madison, WI | 46.91 | 48 | 70 | 3 | 73 |
| 55 | Columbus, OH | 46.83 | 52 | 50 | 35 | 61 |
| 56 | Omaha, NE | 46.72 | 44 | 45 | 38 | 75 |
| 57 | Nashville, TN | 46.61 | 34 | 54 | 42 | 88 |
| 58 | Arlington, TX | 46.23 | 66 | 60 | 54 | 36 |
| 59 | Mesa, AZ | 46.20 | 73 | 58 | 69 | 20 |
| 60 | Garland, TX | 45.74 | 93 | 2 | 96 | 33 |
| 61 | Anaheim, CA | 45.68 | 54 | 81 | 90 | 6 |
| 62 | Miami, FL | 45.52 | 8 | 95 | 78 | 68 |
| 63 | Winston-Salem, NC | 45.44 | 86 | 21 | 79 | 39 |
| 64 | Bakersfield, CA | 45.36 | 85 | 52 | 94 | 2 |
| 65 | Colorado Springs, CO | 45.36 | 57 | 65 | 64 | 42 |
| 66 | Chesapeake, VA | 45.35 | 95 | 64 | 2 | 47 |
| 67 | Seattle, WA | 45.16 | 20 | 92 | 31 | 70 |
| 68 | Washington, DC | 45.04 | 14 | 97 | 15 | 93 |
| 69 | Plano, TX | 44.78 | 70 | 71 | 30 | 45 |
| 70 | Toledo, OH | 44.65 | 87 | 13 | 56 | 50 |
| 71 | Charlotte, NC | 44.35 | 40 | 53 | 84 | 71 |
| 72 | Buffalo, NY | 44.30 | 35 | 66 | 33 | 100 |
| 73 | Santa Ana, CA | 44.20 | 74 | 73 | 70 | 21 |
| 74 | Virginia Beach, VA | 44.07 | 43 | 63 | 47 | 90 |
| 75 | Stockton, CA | 43.92 | 91 | 80 | 53 | 10 |
| 76 | Greensboro, NC | 43.64 | 82 | 18 | 68 | 57 |
| 77 | Boston, MA | 43.45 | 23 | 96 | 10 | 98 |
| 78 | Lubbock, TX | 43.06 | 89 | 30 | 81 | 48 |
| 79 | Raleigh, NC | 42.80 | 56 | 33 | 88 | 79 |
| 80 | Gilbert, AZ | 42.62 | 96 | 48 | 95 | 14 |
| 81 | Lexington-Fayette, KY | 42.29 | 77 | 42 | 71 | 62 |
| 82 | Wichita, KS | 41.56 | 76 | 4 | 93 | 85 |
| 83 | Laredo, TX | 41.44 | 100 | 62 | 74 | 31 |
| 84 | Corpus Christi, TX | 41.38 | 72 | 36 | 83 | 66 |
| 85 | Indianapolis, IN | 41.36 | 49 | 26 | 98 | 99 |
| 86 | Aurora, CO | 41.11 | 84 | 38 | 59 | 65 |
| 87 | Baltimore, MD | 41.10 | 39 | 77 | 66 | 89 |
| 88 | Fremont, CA | 40.84 | 98 | 87 | 26 | 24 |
| 89 | Memphis, TN | 40.69 | 61 | 24 | 97 | 87 |
| 90 | Anchorage, AK | 40.36 | 60 | 90 | 4 | 82 |
| 91 | Oakland, CA | 39.97 | 68 | 91 | 18 | 51 |
| 92 | San Jose, CA | 39.35 | 67 | 99 | 37 | 23 |
| 93 | Fresno, CA | 39.26 | 92 | 83 | 80 | 19 |
| 94 | Hialeah, FL | 39.22 | 80 | 86 | 77 | 38 |
| 95 | Fort Wayne, IN | 38.73 | 78 | 20 | 91 | 96 |
| 96 | Chula Vista, CA | 37.07 | 99 | 76 | 87 | 29 |
| 97 | Irving, TX | 36.22 | 97 | 67 | 61 | 76 |
| 98 | Durham, NC | 36.13 | 79 | 49 | 100 | 79 |
| 99 | Newark, NJ | 35.92 | 83 | 74 | 50 | 97 |
| 100 | Jersey City, NJ | 34.94 | 81 | 93 | 58 | 55 |
Note: With the exception of “Total Score,” all of the columns in the table above depict the relative rank of that city, where a rank of 1 represents the best conditions for that metric category.

- Lowest
- 1. Milwaukee, WI
- T-2. Oklahoma City, OK
- T-2. Raleigh, NC
- 4. El Paso, TX
- 5. Toledo, OH
- Highest
- 96. Boston, MA
- T-97. New York, NY
- T-97. Jersey City, NJ
- T-99. San Jose, CA
- T-99. Fremont, CA

- Lowest
- 1. Tulsa, OK
- 2. Corpus Christi, TX
- 3. Lubbock, TX
- T-4. Riverside, CA
- T-4. San Bernardino, CA
- Highest
- 96. Honolulu, HI
- T-97. Los Angeles, CA
- T-97. Long Beach, CA
- 99. New York, NY
- 100. Stockton, CA

- Lowest
- T-1. Las Vegas, NV
- T-1. Henderson, NV
- T-1. North Las Vegas, NV
- 4. Austin, TX
- 5. Lexington-Fayette, KY
- Highest
- 96. San Jose, CA
- 97. Oakland, CA
- 98. Fremont, CA
- 99. San Francisco, CA
- 100. Stockton, CA

- Most
- T-1. Honolulu, HI
- T-1. Norfolk, VA
- 3. Omaha, NE
- 4. Atlanta, GA
- 5. Washington, DC
- Fewest
- 94. El Paso, TX
- 95. Fresno, CA
- 96. Gilbert, AZ
- 97. Irving, TX
- 98. Mesa, AZ

- Most
- T-1. St. Louis, MO
- T-1. Pittsburgh, PA
- T-1. Cincinnati, OH
- T-1. Orlando, FL
- T-1. Anchorage, AK
- Fewest
- 96. Chicago, IL
- 97. Hialeah, FL
- 98. Laredo, TX
- 99. Los Angeles, CA
- 100. New York, NY

- Most
- T-1. Las Vegas, NV
- T-1. Nashville, TN
- T-1. New Orleans, LA
- T-1. San Francisco, CA
- T-1. Austin, TX
- Fewest
- 95. Newark, NJ
- 96. Irving, TX
- 97. Stockton, CA
- 98. Fremont, CA
- 99. Laredo, TX

- Highest
- T-1. Anchorage, AK
- T-1. Fremont, CA
- T-1. Scottsdale, AZ
- 4. Chesapeake, VA
- 5. New Orleans, LA
- Lowest
- 94. Laredo, TX
- 95. Mesa, AZ
- 96. Fresno, CA
- 97. Baton Rouge, LA
- 98. Hialeah, FL
In-Depth Look at the Best Cities for Recreation
Las Vegas, NV
Las Vegas is the best city for recreation, and not just because of its famous casinos. It also has an extremely high number of attractions overall, ranking at the top of the country when it comes to the number of music venues, amusement parks, zoos and aquariums per capita.
In addition, Las Vegas is a great city for staying active, boasting a very high number of basketball hoops, hiking trails, bowling alleys, sport venues and park playgrounds per capita. This creates opportunities for people of all ages to pursue fitness while having fun.
Finally, Las Vegas has plenty of good places to eat, as it’s one of the best cities for the availability of affordable restaurants with 4.5+ stars. It ranks among the top cities when it comes to the number of food festivals, food tours and ice cream shops per capita. And despite what you might expect, food and beverage prices in Las Vegas are lower than average. It’s even one of the cheapest cities for burgers.
Orlando, FL
Orlando, FL, is the second-best city for recreation, due in large part to its amusement parks such as Disney World and Universal Studios. In addition, Orlando has a very high number of water parks, boat tours, water sports opportunities, zoos, aquariums and pool halls per capita.
There are also a lot of great places for outdoor activities in Orlando. It ranks at the top of the country for sport venues per capita and 11th for the availability of recreational centers. Orlando also has the 12th-highest percentage of city land that is designated as parkland, giving people plenty of space to choose their own types of recreation. Orlando is the second-best city for soccer fans, too.
When it comes to dining, Orlando has an especially high number of restaurants per capita, and it’s one of the best cities for affordable restaurants rated at least 4.5 stars. It also has a large number of ice cream and frozen yogurt shops per capita, along with the most food festivals.
Cincinnati, OH
Cincinnati, OH, is the third-best city for recreation, and as an inland city, it excels in land-based recreational activities, ranking highly for its number of public and municipal golf courses per capita, as well as facilities for baseball and softball diamonds per capita, and bowling centers per capita. Cincinnati is also home to the ninth-highest number of baseball fans in the country, reflecting its deep-rooted passion for the sport.
Cincinnati’s seasonal climate makes it ideal for outdoor recreation, especially in the fall and spring. It ranks high nationally for amusement parks and playgrounds per capita, offering plenty of options for families and outdoor enthusiasts alike.
Finally, Cincinnati has the third-most coffee & tea shops per capita overall, and when it comes to affordable restaurants with at least 4.5 stars, it’s one of the top cities. It also has a very high number of public swimming pools and ice cream shops.
To determine the best and worst cities for recreation, WalletHub compared a sample of the 100 most populated U.S. cities across four key dimensions: 1) Entertainment & Recreational Facilities, 2) Costs, 3) Quality of Parks and 4) Weather. Our sample considers only the city proper in each case and excludes cities in the surrounding metro area.
We evaluated the four dimensions using 47 relevant metrics, which are listed below with their corresponding weights. Each metric was graded on a 100-point scale, with a score of 100 representing the highest level of recreation-friendliness. For metrics marked with an asterisk (*), the square root of the population was used to calculate the population size in order to avoid overcompensating for minor differences across cities.
Finally, we determined each city’s weighted average across all metrics to calculate its overall score and used the resulting scores to rank-order our sample.
Entertainment & Recreational Facilities – Total Points: 40
- Number of Attractions: Double Weight (~2.62 Points)
- Music Venues per Capita*: Full Weight (~1.31 Points)
- Coffee & Tea Shops per Capita*: Full Weight (~1.31 Points)
- Public Beaches per Capita*: Half Weight (~0.66 Points)
- Tennis Courts per Capita*: Full Weight (~1.31 Points)
- Public & Municipal Golf Courses per Capita*: Full Weight (~1.31 Points)
- Public Swimming Pools per Capita*: Full Weight (~1.31 Points)
- Baseball & Softball Diamonds per Capita*: Full Weight (~1.31 Points)
- Basketball Hoops per Capita*: Full Weight (~1.31 Points)
- Bike Rental Facilities per Capita*: Full Weight (~1.31 Points)
- Bike Score: Full Weight (~1.31 Points)
- Walk Score: Full Weight (~1.31 Points)
- Hiking Trails per Capita*: Full Weight (~1.31 Points)
- Fishing Spots per Capita*: Full Weight (~1.31 Points)
- Amusement Parks per Capita*: Full Weight (~1.31 Points)
- Presence on TripAdvisor’s “Top 25 Amusement & Water Parks” List: Full Weight (~1.31 Points)
- Boat Tours & Water Sports per Capita*: Full Weight (~1.31 Points)
- Water Parks per Capita*: Full Weight (~1.31 Points)
- Food & Wine Tours per Capita*: Full Weight (~1.31 Points)
- Zoos & Aquariums per Capita*: Full Weight (~1.31 Points)
- Motion Picture Theaters and Drive-Ins per Capita*: Full Weight (~1.31 Points)
- Bowling Centers per Capita*: Full Weight (~1.31 Points)
- Pool Halls per Capita*: Full Weight (~1.31 Points)
- Restaurants per Capita*: Full Weight (~1.31 Points)
- Food Festivals per Capita*: Full Weight (~1.31 Points)
- Ice Cream & Frozen Yogurt Shops per Capita*: Full Weight (~1.31 Points)
- Sports Fan-Friendliness: Full Weight (~1.31 Points)
Note: This metric is based on WalletHub’s “Best Sports Cities” ranking. Sports include football, basketball, baseball, hockey and soccer. - Intramural Leagues per Capita*: Full Weight (~1.31 Points)
- Sport Venues per Capita*: Full Weight (~1.31 Points)
- Recreational Centers per Capita*: Full Weight (~1.31 Points)
Costs – Total Points: 30
- Spending on Parks and Recreation per Capita: Half Weight (~1.30 Points)
- Average Fitness Club Fee: Full Weight (~2.61 Points)
- Average Cost of Tennis-Court Rent: Full Weight (~2.61 Points)
Note: This metric considers the cost of rent for one hour during the weekend. - Movie Costs: Full Weight (~2.61 Points)
- Bowling Costs: Full Weight (~2.61 Points)
- Grooming Costs: Full Weight (~2.61 Points)
- Average Price per Massage Treatment: Full Weight (~2.61 Points)
Note: Massage Treatment refers to both deep tissue and Swedish massage. - Average Alcoholic Beverage Price: Full Weight (~2.61 Points)
Note: “Alcoholic Beverage” refers to both beer and wine. “Beer” refers to a six-pack of 12-ounce Heineken containers, excluding any deposit. “Wine” refers to a 1.5-liter bottle of Chablis, Chenin Blanc or any white table wine. - Average Food Price: Full Weight (~2.61 Points)
Note: “Food” refers to both hamburger and pizza. “Hamburger” refers to a ¼-pound patty with cheese, pickle, onion, mustard, and ketchup. “Pizza” refers to an 11"-12" thin crust cheese pizza. - Prevalence of Affordable 4.5+ Star Restaurants: Full Weight (~2.61 Points)
- Restaurant Meal Costs: Double Weight (~5.22 Points)
Quality of Parks – Total Points: 20
- Share of Population with Walkable Park Access: Full Weight (~4.00 Points)
- Share of Designed Parkland Areas: Full Weight (~4.00 Points)
- Park Playgrounds per Capita*: Full Weight (~4.00 Points)
- Parkland as Share of City Area: Full Weight (~4.00 Points)
- Acres of Parkland per 1,000 Residents: Full Weight (~4.00 Points)
Weather – Total Points: 10
- Ideal Weather (~10.00 Points)
Note: This metric is based on WalletHub’s “Cities with the Best & Worst Weather” ranking.
Sources: Data used to create this ranking were collected as of June 15, 2026 from the U.S. Census Bureau, Council for Community and Economic Research, The Trust for Public Land, Yelp.com, TripAdvisor, Numbeo.com, Areavibes, 2Book, Walk Score, GolfLink, IMLeagues and WalletHub research.


