Bianca Williams was tired of trying to find a store that either accepted federal food benefits for low-income mothers and their children or a store that had quality produce.
So the Milwaukee resident — who has seven kids, including two currently being breastfed — decided in November that she’d rather turn to frozen Thanksgiving leftovers and food from family and friends.

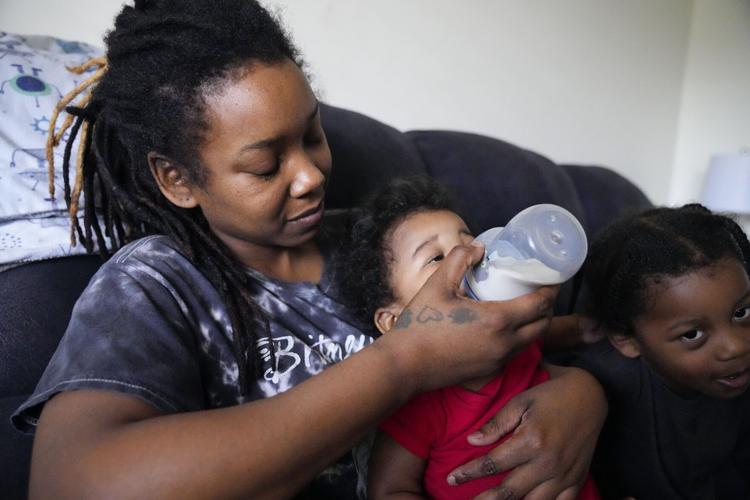
Ashley Yancey feeds her 11 month-old daughter Olivia as 2-year old Oliver Tolvert looks on Dec. 14 in Douglasville, Ga. Yancey, who doesn’t own a car, recently tried to find formula for her daughter at a Target and was stunned the location didn’t accept WIC.
More than 6 million people in the U.S. get benefits from the Special Supplemental Nutrition Program for Women and Children, commonly known as WIC. But it’s not always easy to get the fresh produce, baby formula and other nutritious WIC-approved items.
Williams' closest Walmart shuttered in 2016. Since then, she said, WIC can be “too much of a hassle."
“Sometimes, to be honest, I don’t even use it,” said Williams, who makes about $7 too much a month to qualify for food stamps, “because it’s so hard to get to and from the grocery store, and find a vendor that does accept (WIC).”
People are also reading…
Unlike food stamps, WIC-approved items can’t be bought online, though a few states are working on pilot programs to make it a reality. Complex requirements make it tough for smaller stores — and sometimes big-name grocers — to participate in WIC. Some states are trying to expand access after vendors left over the last five years due to changes in the program or closing down during the pandemic.
“It’s really set up to be a program, at least in our area, that a large full-scale grocer can participate in,” said Ann Sanders, the director of public benefits policy and programs at the Pennsylvania nonprofit Just Harvest. Since 2019, the state has seen a net loss of 353 vendors.
Though both are under the U.S. Department of Agriculture, WIC differs from the Supplemental Nutrition Assistance Program (SNAP), commonly known as food stamps, because SNAP participants can buy almost any grocery item they want — regardless of the nutritional value. With WIC, states use federal guidelines to choose products and quantities that vendors are required to carry; brands commonly found on WIC-approved lists include Cheerios, Juicy Juice and Similac.

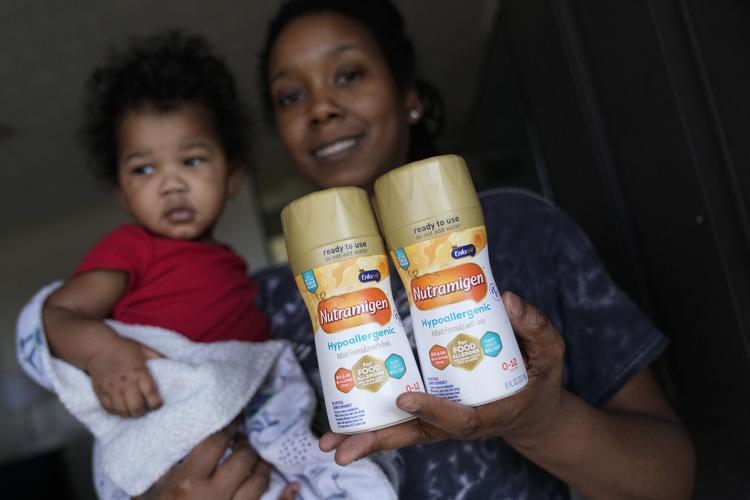
Ashley Yancey holds her 11 month-old daughter, Olivia, as she shows the last two cans of non-dairy formula she has left Dec. 14 at her home in Douglasville, Ga. “I have to borrow somebody’s car to go look for the milk, just to not find the milk.”
Many smaller stores participate in WIC because community members need the help, but it can come at a cost, according to the National Grocers Association, which lobbies for independent stores.
“It’s not necessarily a big moneymaker for them by any means,” said Stephanie Johnson, the association’s vice president of government relations, adding that some “even lose money from participating in WIC.”
WIC programs have been making a slow transition from paper vouchers to electronic benefits, known as eWIC. It’s easier for shoppers, but stores had to spend money on upgrading cash registers, which in Georgia caused some to quit the program.
Michael Gay, who owns Food Fresh, the only grocery store in rural Claxton, Georgia, said eWIC is “very time-consuming at the register" to parse out which items are eligible. Despite that and other frustrations, he has stuck with the program because, “I want you to have it ... I want to sell it, and I want your baby to eat."
National chains don't always participate in WIC, either. Aldi doesn’t because it only carries its own brand of formula. Trader Joe’s told The Associated Press in a statement that the majority of its products don’t meet WIC's brand or size criteria.
About half of Target stores accept WIC, spokesperson Brian Harper-Tibaldo said, because there are different sizes and layouts. He said smaller stores might not have enough shelf space to meet minimum stocking requirements.
Ashley Yancey recently tried to find formula for her daughter at a Target about 30 miles from her home in Douglasville, Georgia, and was stunned the location didn’t accept WIC. Often, her nearest WIC vendor is out of the product.
“It’s embarrassing, kinda,” she said about her attempt to use WIC at the Target store. “Because it’s like, are you too good to take WIC? Are you looking at me like I’m poor?"
Yancey doesn’t have a car, and likes the freedom of doing most of her grocery shopping online, where she can use her SNAP benefits; the USDA started piloting online SNAP purchases in 2019 and expanded it during the pandemic.
“It’s harder that I can’t get my milk like that,” she said. “I have to borrow somebody’s car to go look for the milk, just to not find the milk. It is inconvenient that they don’t take WIC online.”

Olivia Yancey, 11 months old, drinks formula made from non-dairy milk Dec. 14 in Douglasville, Ga.
The USDA is reviewing comments on a proposed rule that would remove barriers to online shopping, like not requiring a cashier to be present for WIC transactions. The agency also has paired with the nonprofit Center for Nutrition to pilot online shopping in seven states and with the Rosebud Sioux Tribe. Major retailers Walmart and Hy-Vee are participating in some places.
“I think the states want to see (online shopping), I think they know it would make a big difference for their participants, and I think retailers are on board, too,” said Ali Hard, the policy director for the National WIC Association, which is an advocacy group and frequent federal partner. “It’s a huge equity issue if WIC participants can’t buy their groceries in the same way everybody else can.”
In states where the number of WIC stores has drastically decreased, officials say the impact is most pronounced in rural areas. Louisiana has lost 68 WIC vendors since 2019, and is working on a recruitment plan for stores.
“We want to focus on more of the rural areas and determine where there might be a store that we can have a conversation with,” Bureau of Nutrition Services Director Jennifer Nicklas said. “Some of it just organically happens when we know we’ve had an existing relationship with the store before … that’s going to really help us to develop where exactly we want to have those conversations.”
In New Hampshire, minimum inventory requirements kept smaller, more rural stores out of the program, said Hailey McAlary with the state Bureau of Family Health and Nutrition, so the state decided those stores no longer have to carry things like juice concentrates and pureed meat for infants.
“I think participation and vendor certification are really connected … food shopping, we all know, has to be convenient,” said Rebecca White, the public and government affairs associate for Hanover Co-Op Food stores in New Hampshire and Vermont. “People will buy foods based on what works with their schedule and their lifestyle.”
___
The Associated Press Health and Science Department receives support from the Robert Wood Johnson Foundation. The AP is solely responsible for all content.
Cities with the most residents in need of rental assistance
Cities With the Most Residents in Need of Rental Assistance

Photo Credit: fizkes / Shutterstock
Amid historically high levels of inflation, U.S. households are feeling increased financial pressure from rising costs for food, transportation, and especially housing. For many households, increases in housing costs have been particularly challenging, with the average monthly rent nationwide rising 14.1% in 2021.
Due to concerns about household economic security during the COVID-19 pandemic, policymakers have made relief for housing costs a priority in their response. Congress has allocated more than $46 billion to fund rental assistance programs over the last two years, and many states have used other state or federal dollars to provide additional support.
But needs for rental assistance have varied across the U.S., and not all renters who need assistance have been able to obtain it. As of early 2022, 16.8% of renter households reported that they were behind on rent payments, but only 12.9% of renters have applied for assistance programs and only 5% of renters have received assistance. Nearly two in five applications for assistance are denied.
This has been particularly challenging for certain demographic and economic groups. According to survey data from the U.S. Census Bureau, renters from low-income households and racial and ethnic minorities have been most likely to seek out rental assistance. By income, 20% of renters earning less than $25,000 per year applied for rental assistance, compared to just 2.4% of those earning above $200,000 per year. And among racial and ethnic groups, Black renters were by far the most likely to apply for rental assistance at 24.3%—nearly twice as much as the next-highest group, Hispanic or Latino (13.6%), and more than 2.5 times the rate for respondents identifying as White (9.9%) and Asian (8.7%).
Minority and low income renters were more likely to apply for assistance

These demographic and economic factors have some impact on the locations where renters report applying for assistance. States with lower typical incomes and higher populations of racial and ethnic minorities, like Arkansas and Louisiana, are among the leading states for rental assistance applications.
But other factors are at play as well. States with higher shares of rental assistance applications like Alaska and Hawaii have higher costs of living than many other parts of the country due to their more remote locations. Residents’ difficulties affording regular expenses may have encouraged more renters to seek financial assistance in these areas. Variation in how easily or quickly states process rental assistance applications may also affect people’s likelihood of applying. Ten states approve less than half of rental assistance applications, even though some of these locations have relatively high shares of renters applying or who report being behind on rent.
Alaskan renters were the most likely to apply for assistance

At the metro level, the picture for rental assistance is similarly complex. A mix of demographic and economic characteristics, cost of living, and approval processes is affecting how many renters are applying for and receiving rental assistance, from high-cost metros like New York and Seattle, to economically distressed locales like Detroit.
The data used in this analysis is from the U.S. Census Bureau’s Household Pulse Survey. To determine the locations where the most renters applied for assistance, researchers at Porch calculated the percentage of renters that applied for assistance between January and February of 2022. In the event of a tie, the location with the higher percentage of renters that received assistance was ranked higher. Only U.S. states and the 15 major metros with available data from the Household Pulse Survey were included in this analysis.
Here are the major metropolitan areas where the most renters applied for assistance.
15. Boston-Cambridge-Newton, MA-NH

Photo Credit: CO Leong / Shutterstock
- Percentage of renters that applied for assistance: 7.9%
- Percentage of renters that received assistance: 1.6%
- Approval rate for rental assistance applicants: 26.5%
- Percentage of renters behind on rent: 12.2%
14. Atlanta-Sandy Springs-Alpharetta, GA

Photo Credit: ESB Professional / Shutterstock
- Percentage of renters that applied for assistance: 8.4%
- Percentage of renters that received assistance: 1.4%
- Approval rate for rental assistance applicants: 46.8%
- Percentage of renters behind on rent: 11.2%
13. Phoenix-Mesa-Chandler, AZ

Photo Credit: Sean Pavone / Shutterstock
- Percentage of renters that applied for assistance: 8.4%
- Percentage of renters that received assistance: 3.8%
- Approval rate for rental assistance applicants: 58.9%
- Percentage of renters behind on rent: 10.8%
12. Riverside-San Bernardino-Ontario, CA

Photo Credit: Steve Minkler / Shutterstock
- Percentage of renters that applied for assistance: 8.7%
- Percentage of renters that received assistance: 2.9%
- Approval rate for rental assistance applicants: 55.4%
- Percentage of renters behind on rent: 20.1%
11. Washington-Arlington-Alexandria, DC-VA-MD-WV

Photo Credit: Andrei Medvedev / Shutterstock
- Percentage of renters that applied for assistance: 10.5%
- Percentage of renters that received assistance: 5.4%
- Approval rate for rental assistance applicants: 83.1%
- Percentage of renters behind on rent: 13.5%
10. San Francisco-Oakland-Berkeley, CA

Photo Credit: yhelfman / Shutterstock
- Percentage of renters that applied for assistance: 11.7%
- Percentage of renters that received assistance: 4.7%
- Approval rate for rental assistance applicants: 67.1%
- Percentage of renters behind on rent: 11.4%
9. Miami-Fort Lauderdale-Pompano Beach, FL

Photo Credit: Sean Pavone / Shutterstock
- Percentage of renters that applied for assistance: 12.0%
- Percentage of renters that received assistance: 3.1%
- Approval rate for rental assistance applicants: 38.3%
- Percentage of renters behind on rent: 18.4%
8. Los Angeles-Long Beach-Anaheim, CA

Photo Credit: Eric Urquhart / Shutterstock
- Percentage of renters that applied for assistance: 12.1%
- Percentage of renters that received assistance: 5.1%
- Approval rate for rental assistance applicants: 63.2%
- Percentage of renters behind on rent: 16.0%
7. Seattle-Tacoma-Bellevue, WA

Photo Credit: ESB Professional / Shutterstock
- Percentage of renters that applied for assistance: 12.2%
- Percentage of renters that received assistance: 3.2%
- Approval rate for rental assistance applicants: 47.7%
- Percentage of renters behind on rent: 15.2%
6. Philadelphia-Camden-Wilmington, PA-NJ-DE-MD

Photo Credit: Sean Pavone / Shutterstock
- Percentage of renters that applied for assistance: 13.3%
- Percentage of renters that received assistance: 2.8%
- Approval rate for rental assistance applicants: 45.3%
- Percentage of renters behind on rent: 17.1%
5. Dallas-Fort Worth-Arlington, TX

Photo Credit: D Guest Smith / Shutterstock
- Percentage of renters that applied for assistance: 14.9%
- Percentage of renters that received assistance: 5.4%
- Approval rate for rental assistance applicants: 65.1%
- Percentage of renters behind on rent: 11.8%
4. Houston-The Woodlands-Sugar Land, TX

Photo Credit: Tomas Simkus / Shutterstock
- Percentage of renters that applied for assistance: 16.0%
- Percentage of renters that received assistance: 2.3%
- Approval rate for rental assistance applicants: 22.4%
- Percentage of renters behind on rent: 21.5%
3. Chicago-Naperville-Elgin, IL-IN-WI

Photo Credit: wonderlustpicstravel / Shutterstock
- Percentage of renters that applied for assistance: 16.4%
- Percentage of renters that received assistance: 8.8%
- Approval rate for rental assistance applicants: 86.4%
- Percentage of renters behind on rent: 21.9%
2. New York-Newark-Jersey City, NY-NJ-PA

Photo Credit: William Perugini / Shutterstock
- Percentage of renters that applied for assistance: 17.2%
- Percentage of renters that received assistance: 5.9%
- Approval rate for rental assistance applicants: 57.7%
- Percentage of renters behind on rent: 29.3%
1. Detroit-Warren-Dearborn, MI

Photo Credit: Mrbrown928 / Shutterstock
- Percentage of renters that applied for assistance: 19.0%
- Percentage of renters that received assistance: 10.2%
- Approval rate for rental assistance applicants: 81.1%
- Percentage of renters behind on rent: 25.8%