

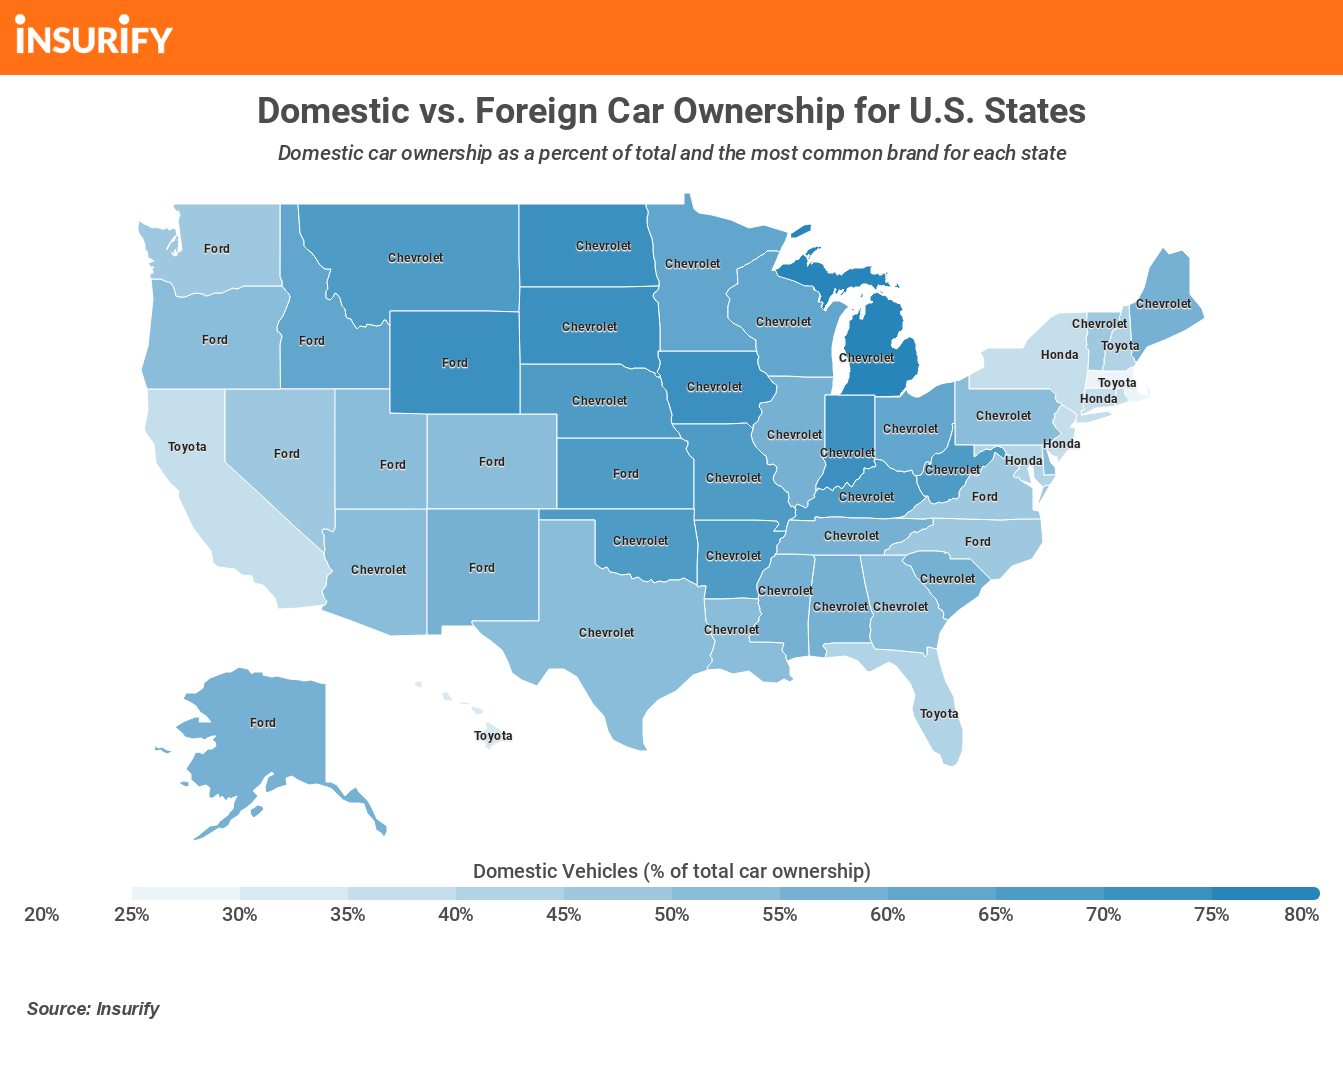
- Regional variations. The ten states with the highest percentages of domestic brands of car are situated in the Midwest and Mountain regions, while foreign car ownership dominates in coastal states. This regional divergence suggests that there might be major differences between automotive purchasing decisions on America’s coasts versus its so-called Heartland.
- Statistical curiosities. The national breakdown as determined by the data is 55.55 percent for domestic makes and 44.45 percent for foreign makes. But for the 10 states with the highest rates of domestic car ownership, the proportion of domestic to foreign cars is much more impressive, with an average breakdown of 71.44 percent domestic to 28.56 percent foreign. Compare this figure with the average breakdown of 62.27 percent foreign to 37.73 domestic for the top 10 states for foreign car ownership.
- Chevy reigns supreme. According to the data, more than half of the states in the union count Chevrolet as its most popular car brand. Only three other brands—Ford, Toyota, and Honda—can claim #1 status in any given state.
People are also reading…
Methodology
The team of data specialists at Insurify, an insurance quote comparison website, compiled data from its database of over 1.5 million car insurance applications, which ask questions about driving history, vehicle type, and other personal data. The data team at Insurify ranked the top 10 states with the highest percentage of applicants who reported driving a domestic make of motor vehicle, and did the same for foreign makes. From this data, they were able to determine the most popular car brand for each state listed, as well as the likelihood of domestic or foreign vehicle ownership as an index against national averages (calculated by determining the average breakdown of domestic versus foreign vehicle ownership across all fifty states, plus the District of Columbia). The national breakdown as determined by the data is 55.55 percent for domestic makes and 44.45 percent for foreign makes.
