TIJUANA, Mexico — Hours before sunrise, migrants at one of Mexico's largest shelters wake up and go online, hoping to secure an appointment to try to seek asylum in the United States. The daily ritual resembles a race for concert tickets when online sales begin for a major act, as about 100 people glide their thumbs over phone screens.
New appointments are available each day at 6 a.m., but migrants find themselves stymied by error messages from the U.S. government's CBPOne mobile app that's been overloaded since the Biden administration introduced it Jan. 12.

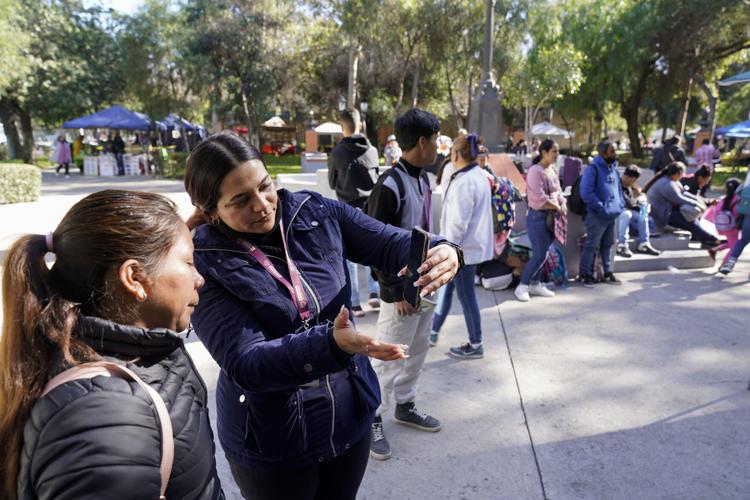
Migrants get help with the CPBOne app Jan. 24 from workers from the city of Tijuana, Mexico.
Many can't log in; others are able to enter their information and select a date, only to have the screen freeze at final confirmation. Some get a message saying they must be near a U.S. crossing, despite being in Mexico's largest border city.
At Embajadores de Jesus in Tijuana, only two of more than 1,000 migrants got appointments in the first two weeks, director Gustavo Banda said.
People are also reading…
"We're going to continue trying, but it's a failure for us," Erlin Rodriguez of Honduras said after another fruitless run at an appointment for him, his wife and their two children one Sunday before dawn. "There's no hope."
Mareni Montiel of Mexico was elated to select a date and time for her two children — then didn't get a confirmation code. "Now I'm back to zero," said Montiel, 32, who has been waiting four months at the shelter.
CBPOne replaced an opaque patchwork of exemptions to a COVID-19 public health order known as Title 42 under which the U.S. government has denied migrants' rights to claim asylum since March 2020. Migrants from other countries find themselves in Mexico waiting for an exemption or policy change — unless they try to cross illegally into the U.S.
If it succeeds, CBPOne could be used by asylum-seekers as a safe, orderly alternative to illegal entries, which reached the highest level ever recorded in the U.S. in December. It also could discourage large camps on Mexico's side of the border.
Complaints have surfaced:
Applications are available in English and Spanish only, languages many of the migrants don't speak. Guerline Jozef, executive director of the Haitian Bridge Alliance, said authorities failed to take "the most basic fact into account: the national language of Haiti is Haitian Creole." U.S. Customs and Border Protection says it plans a Creole version in February; it has not announced other languages.

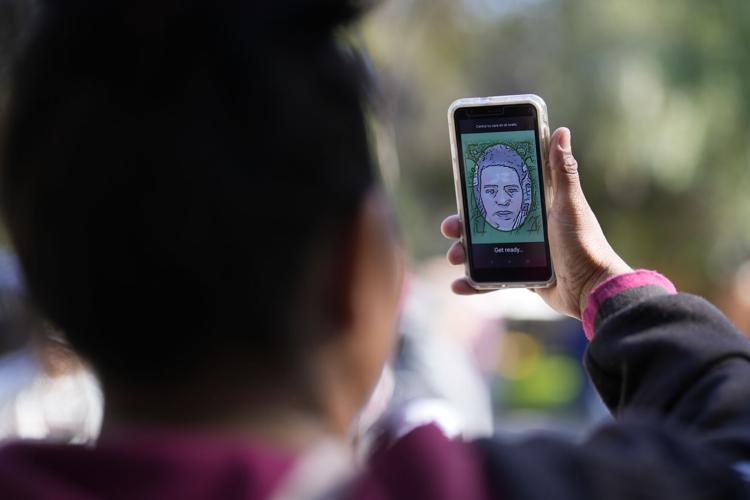
A migrant from Michoacan, Mexico, uses the CBPOne mobile app for migrants seeking asylum in the United States on Jan. 24 in Tijuana, Mexico.
• Some migrants, particularly with darker skin, say the app is rejecting required photos, blocking or delaying applications. CBP says it is aware of some technical issues, especially when new appointments are made available, but users' phones also may contribute. It says a live photo is required for each login as a security measure.
The issue has hit Haitians hardest, said Felicia Rangel-Samponaro, director of The Sidewalk School, which assists migrants in Reynosa and Matamoros, across from Texas' Rio Grande Valley. Previously, about 80% of migrants admitted to seek asylum in the area were Haitian, Rangel-Samponaro said. On Friday, she counted 10 Black people among 270 admitted in Matamoros.
"We brought construction lights pointed at your face," she said. "Those pictures were still not able to go through. … They can't get past the picture part."
• A requirement that migrants apply in northern and central Mexico doesn't always work. CBP notes the app won't work right if the locator function is switched off. It's also trying to determine if signals are bouncing off U.S. phone towers. Applicants outside the region have been able to circumvent the location requirement by using virtual private networks, but the agency said it has found a fix for that and is updating the system.
• Some advocates are disappointed that there is no explicit special consideration for LGBTQ applicants. Migrants are asked if they have a physical or mental illness, disability, pregnancy, lack housing, face a threat of harm, or are under 21 years old or over 70.
Still, LGBTQ migrants are not disqualified. At Casa de Luz, a Tijuana shelter for about 50 LGBTQ migrants, four quickly got appointments. A transgender woman from El Salvador said she didn't check any boxes when asked about specific vulnerabilities.

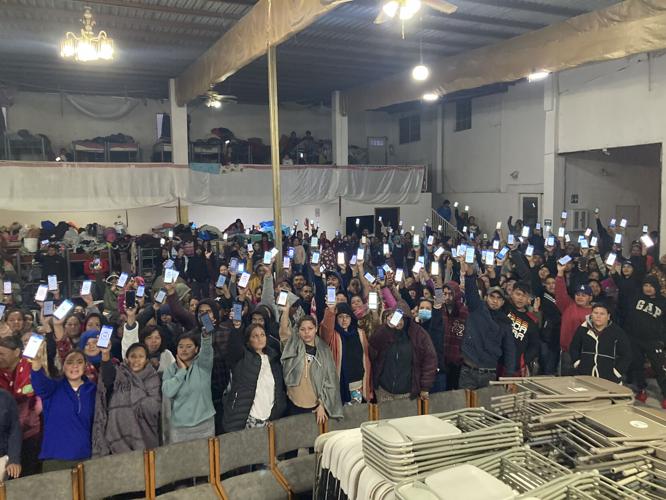
Migrants hold up their phones showing the CBPOne mobile app at a shelter Jan. 22 in Tijuana, Mexico.
Starting in President Joe Biden's first year in office until last week, CBP arranged exemptions through advocates, churches, attorneys and migrant shelters, without publicly identifying them or saying how many slots were available. The arrangement prompted allegations of favoritism and corruption. In December, CBP severed ties with one group that was charging Russians.
For CBPOne to work, enough people must get appointments to discourage crossing the border illegally, said Leon Fresco, an immigration attorney and former aide to Senate Majority Leader Chuck Schumer, a N.Y. Democrat.
"If these appointments start dragging out to two or three or four months, it's going to be much harder to keep it going," he said. "If people aren't getting through, they won't use the program."
CBP, which schedules appointments up to two weeks out, declines to say how many people are getting in.
Cities with the largest immigrant populations
Cities With the Largest Immigrant Populations

Photo Credit: spyarm / Shutterstock
With a foreign-born population of more than 44 million, the U.S. has the largest number of immigrants in the world. In fact, research from the Pew Research Center shows that the U.S. immigrant population accounts for one-fifth of the world’s migrants. While U.S. immigrants come from almost every country in the world, Mexico is the most common country of origin for the foreign-born population.
From the period of 1850 to 2020, when the most recent data is available, the foreign-born population share hit a high of 14.8% in 1900. From 1920 to 1980, the share of immigrants fell, dropping to a low of 4.7% in 1980. Until recently, the immigrant share of the population had been climbing and was at a near historic high in 2019 before the pandemic. The share of immigrants dropped slightly in 2020 to 13.5%, down from the 13.7% it had stood at for the last several years.
The US foreign born population share was at a near historic high before the pandemic

Accounting for 24.8% of the foreign-born population, Mexico claims the largest number of U.S. immigrants. The Chinese and Indian immigrant populations are also large, making up a collective 12.2% of the foreign-born population. Pew Research Center analysis of Census Bureau data shows that about one million immigrants arrive in the U.S. each year, and the most common region for new immigrants is now Asia, which recently surpassed Hispanic countries.
Mexican immigrants account for nearly 25 percent of the foreign born population

While immigrants live in every U.S. state, some parts of the country have larger foreign-born populations than others. Over one-fourth of California’s population is foreign-born—mostly coming from Mexico—making California the top state for immigrants. New Jersey and New York also have large immigrant populations, with 22.7% and 22.4% of their populations being immigrants, respectively. Alternatively, Montana and West Virginia have very small immigrant populations, accounting for just 2.2% and 1.6% of their populations, respectively.
More than a quarter of the California population is foreign born

To determine the U.S. metropolitan areas with the largest immigrant populations, researchers at BackgroundChecks.org analyzed the latest data from the U.S. Census Bureau. The researchers ranked metros according to the foreign-born population share. Researchers also calculated the most common country of origin, the total foreign-born population, and the total population.
To improve relevance, only metropolitan areas with at least 100,000 people were included in the analysis. Additionally, metro areas were grouped into the following cohorts based on population size:
- Small metros: 100,000–349,999
- Midsize metros: 350,000–999,999
- Large metros: more than 1,000,000
Here are the metros with the largest immigrant populations.
Small and midsize metros with the most immigrants

15. Sacramento-Roseville-Folsom, CA

Photo Credit: Andriy Blokhin / Shutterstock
- Foreign-born population share: 18.5%
- Most common country of origin: Mexico
- Total foreign-born population: 432,837
- Total population: 2,338,866
14. Dallas-Fort Worth-Arlington, TX

Photo Credit: f11photo / Shutterstock
- Foreign-born population share: 18.5%
- Most common country of origin: Mexico
- Total foreign-born population: 1,376,117
- Total population: 7,451,858
13. Orlando-Kissimmee-Sanford, FL

Photo Credit: Songquan Deng / Shutterstock
- Foreign-born population share: 18.8%
- Most common country of origin: Colombia
- Total foreign-born population: 481,158
- Total population: 2,560,260
12. Boston-Cambridge-Newton, MA-NH

Photo Credit: Travellaggio / Shutterstock
- Foreign-born population share: 18.9%
- Most common country of origin: China
- Total foreign-born population: 918,197
- Total population: 4,854,808
11. Seattle-Tacoma-Bellevue, WA

Photo Credit: mahaloshine / Shutterstock
- Foreign-born population share: 19.2%
- Most common country of origin: Mexico
- Total foreign-born population: 754,455
- Total population: 3,928,498
10. Riverside-San Bernardino-Ontario, CA

Photo Credit: Jon Bilous / Shutterstock
- Foreign-born population share: 21.1%
- Most common country of origin: Mexico
- Total foreign-born population: 970,476
- Total population: 4,600,396
9. Las Vegas-Henderson-Paradise, NV

Photo Credit: Virrage Images / Shutterstock
- Foreign-born population share: 22.1%
- Most common country of origin: Mexico
- Total foreign-born population: 492,617
- Total population: 2,228,866
8. Washington-Arlington-Alexandria, DC-VA-MD-WV

Photo Credit: ESB Professional / Shutterstock
- Foreign-born population share: 22.8%
- Most common country of origin: El Salvador
- Total foreign-born population: 1,425,904
- Total population: 6,250,309
7. San Diego-Chula Vista-Carlsbad, CA

Photo Credit: Sean Pavone / Shutterstock
- Foreign-born population share: 22.9%
- Most common country of origin: Mexico
- Total foreign-born population: 762,260
- Total population: 3,323,970
6. Houston-The Woodlands-Sugar Land, TX

Photo Credit: Tomas Simkus / Shutterstock
- Foreign-born population share: 23.3%
- Most common country of origin: Mexico
- Total foreign-born population: 1,623,239
- Total population: 6,979,613
5. New York-Newark-Jersey City, NY-NJ-PA

Photo Credit: Lukas Uher / Shutterstock
- Foreign-born population share: 29.3%
- Most common country of origin: Dominican Republic
- Total foreign-born population: 5,652,129
- Total population: 19,261,570
4. San Francisco-Oakland-Berkeley, CA

Photo Credit: yhelfman / Shutterstock
- Foreign-born population share: 30.7%
- Most common country of origin: China
- Total foreign-born population: 1,443,907
- Total population: 4,709,220
3. Los Angeles-Long Beach-Anaheim, CA

Photo Credit: Sean Pavone / Shutterstock
- Foreign-born population share: 32.7%
- Most common country of origin: Mexico
- Total foreign-born population: 4,325,660
- Total population: 13,211,027
2. San Jose-Sunnyvale-Santa Clara, CA

Photo Credit: thetahoeguy / Shutterstock
- Foreign-born population share: 39.1%
- Most common country of origin: China
- Total foreign-born population: 775,944
- Total population: 1,985,926
1. Miami-Fort Lauderdale-Pompano Beach, FL

Photo Credit: Just dance / Shutterstock
- Foreign-born population share: 40.9%
- Most common country of origin: Cuba
- Total foreign-born population: 2,504,666
- Total population: 6,129,858